
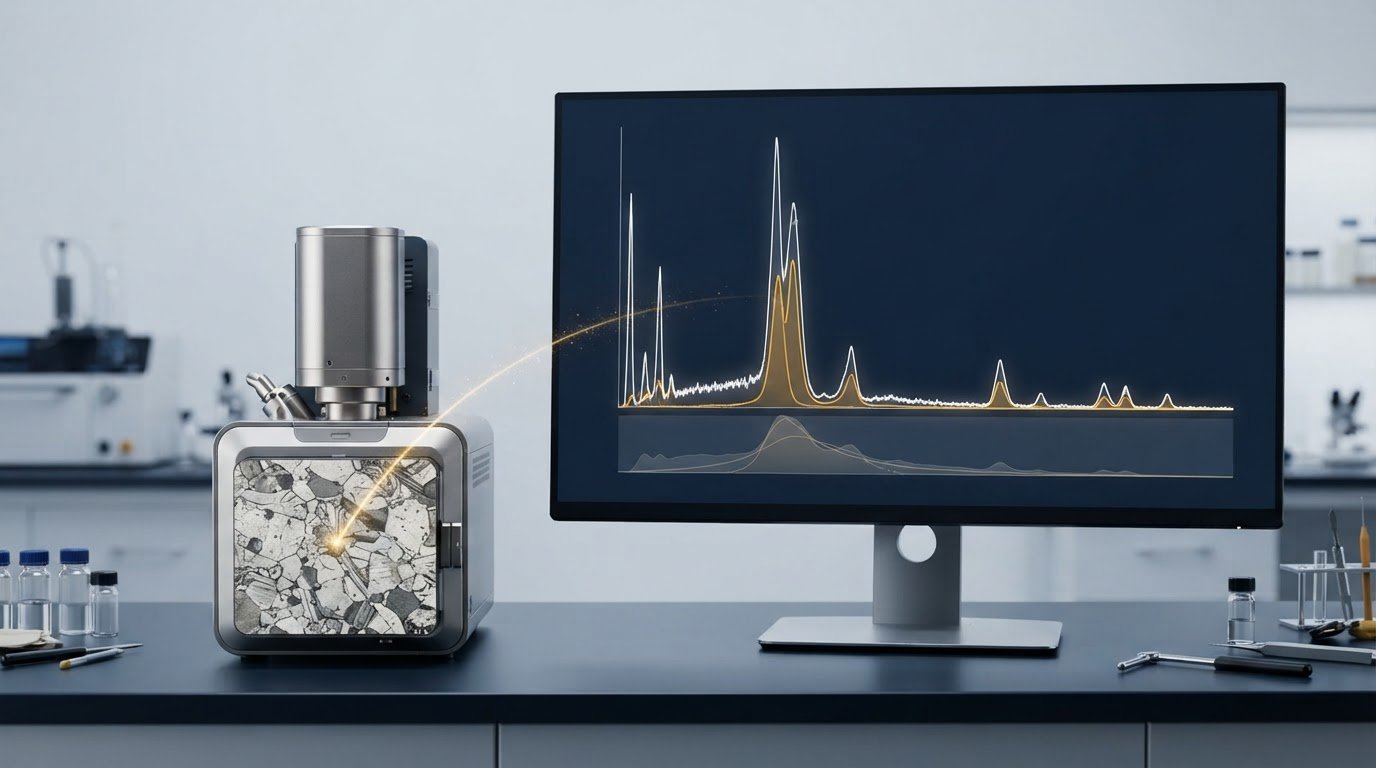
A spectrum can identify an element without proving its precise concentration. When interpreting EDS spectra results, distinguish qualitative identification from quantitative analysis: around 2004, relevant associations established that EDS refers to the spectrometer or spectroscopy technique, while EDX refers to the study of spectroscopy.
A taller peak or several peaks may seem to indicate a stronger elemental presence, but peak count reflects the electron shells involved, not abundance. Peak overlap, detection limits, sample condition, and analysis method also affect what a spectrum reveals.
This article explains how EDS software identifies peaks, why one element can produce multiple peaks, and how quantitative analysis differs from qualitative findings. It also covers unexpected elements and the effects of peak overlap and sample condition, helping you assess what a spectrum supports and where interpretation requires care.
Key Takeaways
- Separate elemental identification from concentration estimates; a qualitative spectrum can indicate which elements are present without establishing precise amounts.
- Assess peak intensity and overlap together, since software may distinguish overlapping signals through peak analysis rather than peak height alone.
- Interpret unexpected or missing elements in light of detection limits, sample condition, and the possibility that weak signals are difficult to resolve.
- For quantitative conclusions, consider whether the sample and analysis conditions support normalization and matrix correction, and treat results accordingly.
Q5: Why do EDS spectra show unexpected elements?
An unexpected peak is a signal to investigate, not automatic proof of contamination. Typical SEM-EDS detectors have an energy resolution of 125-132 eV FWHM at Mn-Kα. FWHM describes peak width at half its maximum intensity. Nearby X-ray lines can therefore appear blended rather than clearly separated. A software assignment may identify a plausible element even when overlapping signals complicate interpretation. Compare the candidate peak’s energy with the full spectrum and inspect possible overlaps before drawing conclusions.
The specimen and its preparation can contribute signals. Mounting materials, conductive coatings, surface residue, or chamber deposits may produce X-rays in the analyzed region. For example, a carbon signal may come from a carbon coating rather than the bulk specimen. Because the electron beam typically penetrates a few microns, detected X-rays can originate below the visible surface. A peak may therefore come from the specimen, a surface layer, or material beneath the target feature.
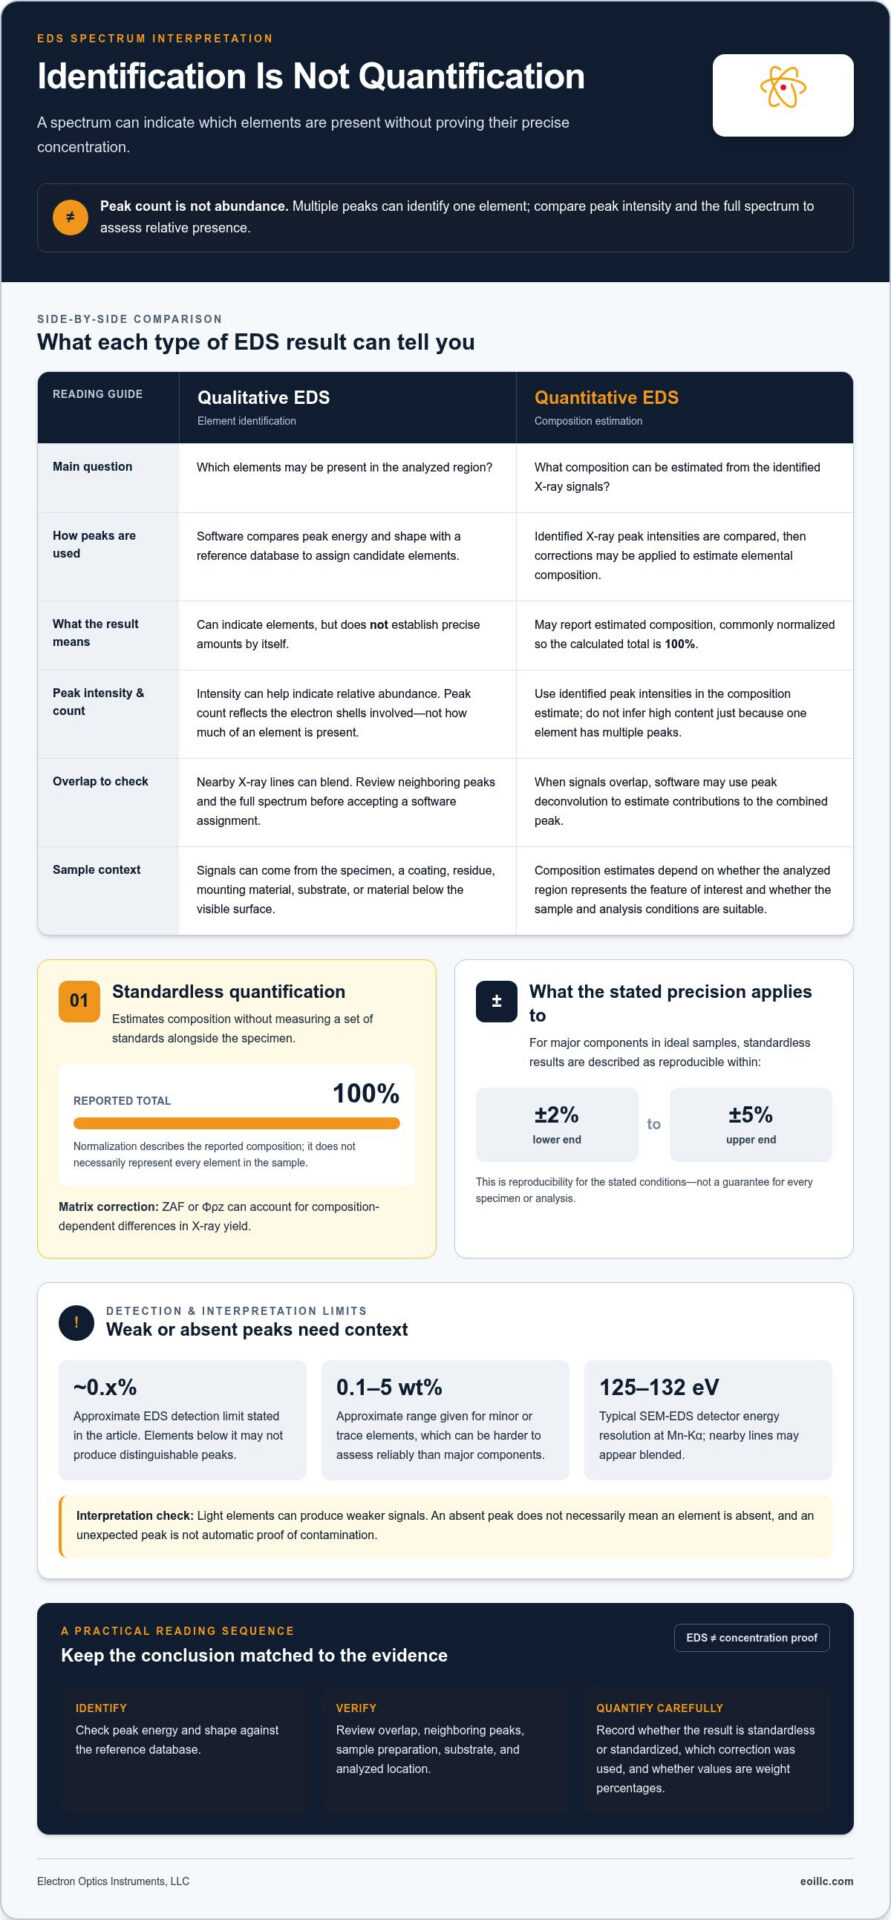
Missing peaks require equal care. The absence of light-element peaks does not necessarily mean those elements are absent. Light elements can produce weaker signals, making detection and identification more difficult. EDS analysis has an approximate detection limit of 0.x%. Elements below that level may not produce distinguishable peaks. Minor or trace elements, described as approximately 0.1-5 wt%, can also be harder to assess reliably than major components. Interpret a weak or absent signal in relation to the element, sample, and measurement conditions.
Accuracy and precision answer different questions. Accuracy concerns closeness to the true composition; precision concerns consistency across repeated measurements. A result can be repeatable yet inaccurate if the same interference affects each reading. For non-flat samples, results can be averaged over three analysis points. Averaging preferably more than 20 EDS data points can reduce errors. Compare repeat measurements and examine whether candidate elements persist across locations. Consistent signals support a more robust interpretation, while isolated peaks warrant attention to overlap, preparation materials, and local sample variation.
Q3: If an element in an EDS spectrum has multiple peaks, does it mean its content is high?
No. For coatings, particles, and thin films, assess the analyzed feature and surrounding material before estimating composition. Multiple peaks can identify one element, but peak count alone does not indicate high content.
Peak Intensity and Element Content
Peak intensity is the signal strength associated with an element and can help indicate its relative abundance in the sample. Peak count, by contrast, reflects the electron shells involved in producing characteristic X-rays. An element with several visible peaks may be present at a lower level than one with a single stronger peak. To compare relative presence, assess peak intensity rather than peak count.
For a particle on a substrate made of a different material, the spectrum may include signals from both. A prominent particle-associated peak can support identification, while substrate peaks complicate estimates of the particle’s composition. For coatings and thin films, interpret peaks in relation to the underlying material rather than attributing every signal to the coating.
Peak Identification and Overlap
EDS software identifies X-ray peaks by comparing their energy and shape with a reference database. This matching helps assign candidate elements, but nearby lines can overlap and complicate interpretation. When signals overlap within the method’s uncertainty, software may use peak deconvolution to estimate the contributions to the combined peak.
Review each assigned element alongside neighboring peaks and the sample’s expected materials. For example, a particle spectrum with a merged peak may support multiple possible assignments until deconvolution separates the signals. Treat the software label as an interpretation of measured peaks, not as proof based on peak count alone.
For coatings and thin films, distinguish surface-layer signals from possible substrate contributions; for particles, consider whether the analyzed area includes surrounding material. These distinctions matter because a spectrum represents the interaction volume, not necessarily a single visible feature. Relate the peak positions and intensities to the feature’s geometry and composition. Appropriate EDS system capabilities can support analysis suited to the specimen and the question being investigated.
Standardized quantitative analysis
Quantify composition by comparing identified X-ray peak intensities, applying corrections, and normalizing results to 100%. Compare EDS values with SEM images by matching analyzed locations and features, then assess differences against other methods using equivalent sample regions and reported units.
Standardized and Standardless Quantification
Standardless quantification estimates elemental composition without measuring a set of standards alongside the specimen. It compares identified peak intensities and normalizes the calculated composition to 100%. A matrix correction, such as ZAF or Φρz, accounts for composition-dependent differences in X-ray yield. For major components in ideal samples, standardless results are reproducible within ±2% to ±5%.
Standardization and quantification are related but not interchangeable. The stated information on standardless analysis says it does not yet have an official national standard. For a useful comparison, record whether results are standardless or standardized, which correction was applied, and whether values are weight percentages. A normalized 100% total describes the reported composition, not necessarily every element in the sample.
Limits and Error Thresholds
Quantitative accuracy depends on sample condition and element concentration. For flat, dry, dense, stable, well-conductive samples, the cited EDS quantitative-analysis standard specifies total quantitative error below ±3%, excluding samples containing ultra-light elements. Relative error allowances vary by concentration: no more than ±5% above 20 wt%, ±10% at 3-20 wt%, ±30% at 1-3 wt%, and ±50% at 0.5-1 wt%.
These thresholds help determine how precisely to interpret reported values. For non-flat samples, total quantitative error exceeding ±5% means results should be treated as semi-quantitative. Normalization can be applied when that error is no more than ±5%, assuming no undetected elements. Compare quantified regions with SEM image morphology, then compare other methods only when they represent equivalent regions and composition units. Surface geometry or differing sampled areas can make apparent disagreements reflect measurement conditions, not composition alone.
Qualitative EDS
Qualitative EDS determines which elements are supported by a measured spectrum; it does not establish their exact concentrations. It identifies elements in a selected region, such as an inclusion, coating, or particle. This is most useful for answering a focused question: which elements occur in this feature? On its own, qualitative EDS does not establish complete material composition or prove that every detected element belongs to the visible feature.
Connect the spectrum to the SEM image by recording where the analysis was collected. A spectrum from a particle may include nearby material if the analyzed area extends beyond its boundary. Compare the selected location with visible morphology, then describe the elemental signals associated with that region. For example, report that an analyzed inclusion has signals consistent with iron and oxygen, rather than assigning those elements to the entire component.
Qualitative interpretation also benefits from comparing locations within the same specimen. If a signal appears in a coating region but not in adjacent substrate areas, that spatial contrast can help distinguish coating-associated elements from the underlying material. An element found in both regions calls for a different interpretation. Record the location, feature, and identified elements together so the conclusion can be traced to the SEM image and measured spectrum.
Keep the conclusion aligned with the evidence. State the detected elements and analyzed region, then separate those findings from any concentration estimate or phase identification. For example, identifying silicon and oxygen does not alone establish a specific silica phase. Such distinctions prevent an elemental result from being presented as a more detailed chemical or structural conclusion. A clear qualitative report tells readers what the spectrum supports, where the signal was measured, and what the result does not establish. To align EDS capabilities with your specimen and analysis goals, discuss your EDS analysis requirements.
Electron Optics Instruments: Cube II Benchtop SEM
Electron Optics Instruments, LLC offers the Cube II Benchtop SEM for teams examining samples with scanning electron microscopy. SEM images provide visual context for the regions under evaluation, helping relate an observed feature to the area represented in an EDS spectrum. This is useful when examining particles, coatings, or material features alongside elemental findings, rather than interpreting a spectrum in isolation.
For workflows combining SEM imaging and elemental analysis, Electron Optics Instruments, LLC also offers EDS systems. The Cube II Benchtop SEM is one equipment option; the Genesis Tabletop SEM and Veritas Series SEM are additional offerings. Choose equipment according to your samples and facility’s work, without assuming that any one instrument can resolve every analytical question.
To discuss SEM and EDS equipment for your analysis needs, contact Electron Optics Instruments, LLC or visit eoillc.com.
Build a More Confident Path from Signal to Decision
An analysis is valuable when it reliably informs the next decision. For future projects, define the analytical question before selecting regions, preserve the links between images and spectra, and use consistent reporting language across analysts. These practices make it easier to compare materials over time and communicate findings between microscopy and engineering teams.
As your workflow develops, treat each interpretation as part of a documented decision process: record what the measurement supports, distinguish observation from inference, and identify when further characterization is needed. This discipline makes interpreting EDS spectra results more useful beyond the instrument, connecting technical evidence to material selection, process review, and quality discussions without overstating what a spectrum can establish.
Electron Optics Instruments can help you consider SEM and EDS equipment suited to your analytical goals. Contact Electron Optics Instruments to discuss your next step and continue building a dependable analytical workflow.
Frequently Asked Questions
Q1: Is the abbreviation for Energy Dispersive Spectroscopy EDS or EDX?
EDS refers to the spectrometer or spectroscopy technique, while EDX refers to the study of spectroscopy. Both abbreviations appear in technical writing, so define the term for readers outside your microscopy team. For example, write “energy-dispersive X-ray spectroscopy (EDS)” on first use, then use EDS consistently in figure captions and analysis notes.
How do you read and interpret an EDS spectrum?
When interpreting EDS spectra results, relate the energy axis, signal intensity, and assigned elemental lines to the analyzed region. Start with the spectrum’s labels and acquisition location, then compare candidate identifications with the specimen’s known materials. For example, interpret a peak measured on a particle alongside the image showing whether the beam targeted the particle or nearby substrate.
How do you identify elements from EDS peak positions?
Identify candidate elements by comparing measured peak energies with characteristic X-ray lines in the EDS software database. Check whether the proposed element has other expected lines in the spectrum instead of relying on one peak position. If several elements have lines near the same energy, treat the assignment as potentially ambiguous and examine the surrounding spectrum before reporting an identification.
What do EDS peak heights and intensities indicate?
Peak intensity indicates an element’s relative abundance in the analyzed sample, while peak count relates to the electron shells producing X-rays. Peak height is not a direct concentration reading across separate acquisitions: collection conditions and the analyzed region affect signal strength. For meaningful comparisons, examine spectra collected under comparable conditions and from equivalent sample locations.
What are the detection limits and accuracy of EDS?
EDS has an approximate detection limit of 0.1%, while accuracy depends on the sample and analytical conditions. For major components in ideal samples, standardless quantitative results are reproducible within ±2% to ±5%. These values describe different limits: detection concerns whether an element’s signal can be identified, while reproducibility describes agreement among repeated quantitative measurements.
How do you distinguish overlapping peaks in an EDS spectrum?
When interpreting EDS spectra results with overlapping peaks, compare candidate line energies, peak shapes, and other expected lines for each proposed element. EDS software may use peak deconvolution to estimate contributions from a combined feature when signals overlap within the method’s uncertainty. Check whether the resulting assignments fit the rest of the spectrum and the specimen’s composition, rather than treating an automated label as conclusive.