
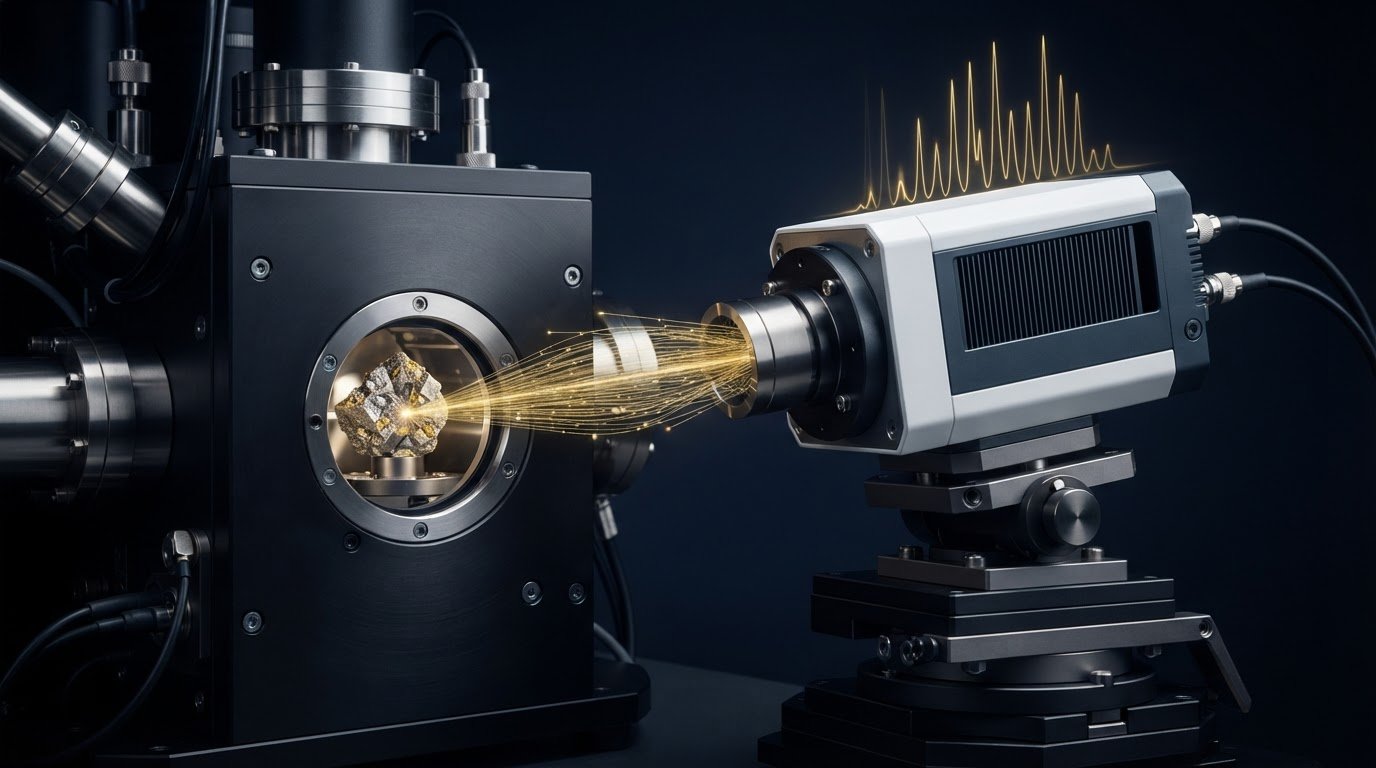
A silicon drift detector (SDD) can support X-ray systems that process over 100,000 counts per second, compared with 10,000 counts per second in the described baseline system. The benefits of a silicon drift detector (SDD) also include maintaining useful energy resolution at higher count rates, which can help capture compositional data efficiently. Its performance, however, depends on more than throughput alone.
For electron microscopy and other X-ray analysis, detector count rate, energy resolution, and quantum efficiency determine how much information can be collected and how clearly it can be interpreted. A high count rate helps measurements keep pace with scanning, while good energy resolution helps distinguish nearby spectral peaks.
This article explains how an SDD works and how these performance factors affect X-ray detection. It also covers detector area, low-energy response, and practical trade-offs to consider when deciding whether an SDD suits a particular analytical task.
Key Takeaways
- Assess detector rate against the pace of your measurements to understand how efficiently the system can collect X-ray counts.
- Compare energy resolution across the spectral range relevant to your analysis, especially when distinguishing nearby peaks matters.
- Consider quantum efficiency alongside detector rate and resolution to evaluate how effectively incoming X-rays contribute to useful data.
- Connect detector performance requirements to your microscopy workflow to identify which SEM configuration best supports the analysis.
Detector rate and flux
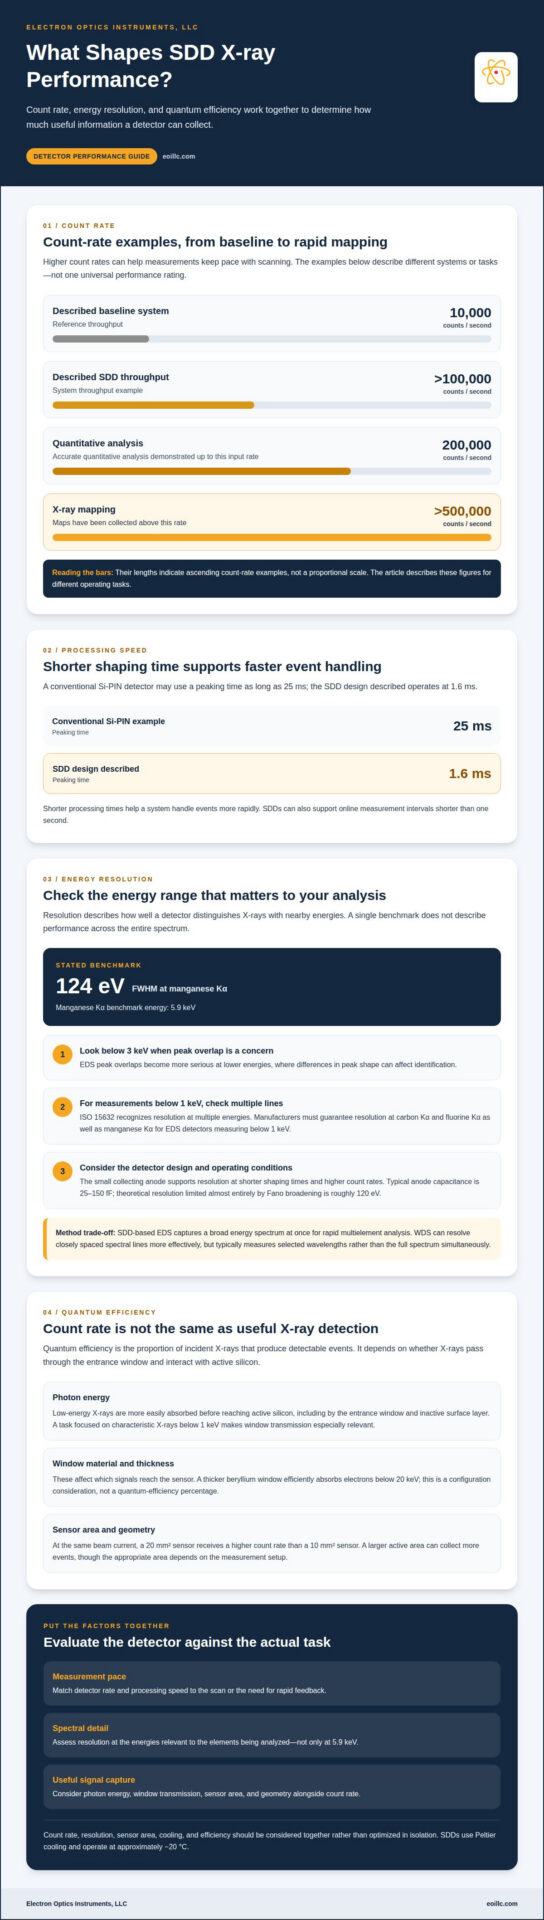
Detector rate describes how quickly a system records incoming X-ray events, while flux describes the incident radiation reaching the detector. Together, they shape acquisition speed and the volume of data available for analysis. A conventional Si-PIN detector may use a peaking time as long as 25 ms; an SDD design described here operates at 1.6 ms. Shorter processing times help a system handle events more rapidly.
The difference can be substantial: a described SDD increases system throughput from 10,000 counts per second to over 100,000 counts per second. Accurate quantitative analysis has been demonstrated at input rates up to 200,000 counts per second, and X-ray maps have been collected above 500,000 counts per second. These figures describe different operating tasks, so they shouldn’t be treated as one universal performance rating.
For online processing, SDDs can support measurement intervals shorter than one second. That capability is useful when an application needs rapid feedback or maps must keep pace with a scan. Detector area also affects count rate: at the same beam current, a 20 mm² sensor receives a higher count rate than a 10 mm² sensor. A larger active area can collect more events, though the suitable area depends on the measurement setup.
SDDs use Peltier devices to cool the sensor, operating at approximately -20 °C. This is a practical cooling requirement to account for when comparing detector configurations; older X-ray detectors shouldn’t be assumed to share the same operating conditions. Pricing depends on detector area, electronics, cooling requirements, and system configuration, with the price provided after a quote request.
Typical specifications vary by design and task. Examples include 10 mm² and 20 mm² active areas, a 124 eV resolution figure, and rates ranging from quantitative analysis at up to 200,000 counts per second to mapping above 500,000. A limitation is that count rate, resolution, sensor area, and cooling must be considered together rather than optimized in isolation.
SEM/EDS and X-ray fluorescence analysis (EDXRF) both use SDDs. In electron microscopy, an EDS system pairs X-ray detection with elemental analysis, particularly when rapid maps or short measurement intervals are important.
Energy resolution
Energy resolution describes how well an EDS detector distinguishes X-rays with nearby energies. A sharper peak can help separate elemental signals that overlap in a spectrum. SDD performance is often reported using the manganese Kα line at 5.9 keV, with one stated resolution figure of 124 eV full width at half maximum. That benchmark is useful, but it doesn’t describe performance across the entire spectrum.
Low-energy response also matters. EDS peak overlaps become more serious below 3 keV, where modest differences in peak shape can affect identification. ISO 15632 recognizes that detector resolution should be considered at multiple energies. For EDS detectors measuring X-rays below 1 keV, manufacturers must guarantee resolution at carbon Kα and fluorine Kα as well as manganese Kα.
SDDs use a small collecting anode, reducing capacitance and supporting resolution at shorter shaping times and higher count rates. Typical anode capacitance is 25-150 fF. Theoretical resolution limited almost entirely by Fano broadening is roughly 120 eV, close to the stated 124 eV figure. Modern SDDs also have lower electronic noise than lithium-drifted silicon detectors, particularly at short peaking times, larger detector areas, and low X-ray energies.
Compared with wavelength-dispersive X-ray spectroscopy (WDS), SDD-based EDS captures a broad energy spectrum at once, making it useful for rapid multielement analysis. WDS separates X-rays by wavelength and can resolve closely spaced spectral lines more effectively, but typically measures selected wavelengths rather than collecting the full spectrum simultaneously. The right method depends on whether speed, broad elemental screening, or separation of overlapping peaks matters most.
For electron microscopy, evaluate resolution at the energies relevant to the elements being analyzed, not only at 5.9 keV. An energy-dispersive X-ray analysis workflow can make this spectral-resolution assessment part of practical EDS system selection.
Quantum efficiency for X-ray detection
Quantum efficiency is the proportion of incident X-rays that produce detectable events. In an SDD, it depends on whether X-rays pass through the detector entrance window and interact with the active silicon. Count rate alone does not show how many photons were absorbed, so efficiency and throughput describe different aspects of detector performance.
Energy matters. Low-energy X-rays are more easily absorbed by material before reaching the active silicon, including the entrance window and any inactive surface layer. Consequently, two detector designs exposed to the same spectrum can register different numbers of useful events. For example, an analysis focused on characteristic X-rays below 1 keV places greater emphasis on window transmission than an analysis focused on higher-energy lines.
Window material and thickness therefore influence which signals reach the sensor. A thicker beryllium window efficiently absorbs electrons below 20 keV, a consideration when assessing detector configuration and the particles reaching the detector. That fact should not be mistaken for a quantum-efficiency percentage: the actual X-ray response depends on the full detector design and the photon energies of interest.
Sensor area and geometry affect how many X-rays are available for detection, while the active silicon’s ability to absorb photons varies with their energy. To evaluate an SDD for a specific task, match its response to the expected spectrum rather than relying on one efficiency figure. For example, elemental analysis that depends on low-energy peaks requires a configuration that limits losses before photons reach the active region.
A practical assessment compares expected X-ray energies with window transmission, inactive-layer effects, and silicon absorption. It also distinguishes detection efficiency from spectral resolution: efficiency concerns registering incoming photons, while resolution concerns separating their energies. These measures complement each other, and a detector suited to one energy range may not perform as well in another. In SEM/EDS, this distinction helps determine whether the detected spectrum can support the intended elemental analysis.
What is a silicon drift detector and how does it work?
A silicon drift detector converts incoming X-rays into electrical signals that an EDS system can measure. The basic form was proposed by Gatti and Rehak in 1983. Unlike a detector that collects charge across a broad area, an SDD uses electric fields within silicon to guide charge toward a small collecting anode.
When an X-ray interacts with silicon, it generates charge carriers. An arrangement of electrodes creates a potential gradient that directs electrons through the sensor toward the anode. The collected charge corresponds to the X-ray’s energy, allowing the system to build a spectrum from detected events. In electron microscopy, that spectrum can help identify the elements in a sample.
The small anode is central to the design. Its low capacitance reduces electronic noise and supports signal processing at shorter shaping times. The SDD bulk material has a stated resistivity range of 1-10 kΩ-cm, while the built-in potential for high-resistivity material is approximately 0.7 V. These properties contribute to the electric-field structure that moves charge toward the collection point.
In an offset-anode design, the field-effect transistor (FET) sits outside the active area. This placement protects the FET from incoming radiation, while a short connection to the collecting anode helps limit parasitic capacitance at bonding pads. The resulting signal path links X-ray interaction, charge movement, and amplification in a compact detector architecture.
Cooling controls thermal noise and supports sensor operation. Silicon drift detectors use Peltier devices and operate at a few tens of degrees below zero. The detector converts each useful X-ray event into a measurable pulse, and EDS electronics process those pulses into energy-resolved data. This sequence connects semiconductor physics directly to elemental analysis.
Electron Optics Instruments: Cube II Benchtop SEM
Electron Optics Instruments, LLC offers the Cube II Benchtop SEM for teams evaluating electron microscopy equipment alongside their X-ray analysis requirements. It is a relevant option when your workflow calls for benchtop SEM imaging and elemental analysis planning, with detector performance considered as part of the overall microscopy setup.
Start by defining the samples, imaging needs, and analytical questions that shape your workflow. Electron Optics Instruments, LLC also offers the Genesis Tabletop SEM, Veritas Series SEM, and Veritas Plus SEM, giving you additional SEM configurations to consider. Matching equipment to the task connects detector characteristics with practical microscopy requirements, without treating any single SDD specification as a complete measure of system suitability.
For guidance on SEM options for your application, contact Electron Optics Instruments, LLC or visit eoillc.com.
Turn Detector Requirements Into a Practical SEM Decision
The benefits of a silicon drift detector (SDD) depend on how well its characteristics match the questions your analysis must answer. Define your sample types, imaging priorities, and elemental information needs, then consider how they shape the SEM and EDS configuration. This keeps equipment selection grounded in the work itself, rather than in a single detector specification.
Electron Optics Instruments, LLC can help you evaluate SEM options for your microscopy workflow. Describe your application and analytical priorities to start a discussion about equipment suited to your objectives. If your work evolves, revisit those requirements as your samples and measurement needs change.
Contact Electron Optics Instruments, LLC to discuss your SEM requirements and identify a practical next step. A well-defined application is a strong foundation for moving your analysis forward.
Frequently Asked Questions
What are the main benefits of a silicon drift detector (SDD)?
The main benefits of a silicon drift detector (SDD) include efficient high-rate X-ray collection, strong energy resolution, and low electronic noise. These characteristics can help laboratories collect elemental data quickly while retaining the ability to distinguish spectral features. For example, rapid mapping of a material sample can benefit from processing many detected events while preserving useful information about the elements present.
How does SDD energy resolution compare with Si(Li) and PIN diode detectors?
SDDs can maintain their best energy resolution at count rates of tens of thousands of counts per second, while Si(Li) detectors typically offer best resolution at 1-2 kcps. Compared with conventional Si-PIN detectors, SDDs use a small collecting anode and low capacitance, supporting shorter shaping times. For a practical comparison, consider resolution across the energies relevant to your sample, not one benchmark alone.
How does an SDD’s fast processing improve X-ray spectroscopy throughput?
Faster processing reduces the time needed to resolve detector signals, helping spectroscopy keep pace with data acquisition. It can support quicker elemental mapping and online measurements with intervals shorter than one second. In a scanning workflow, rapid event processing can help maintain spatial detail while collecting X-ray data, although useful throughput also depends on the sample, beam conditions, and measurement settings.
What advantages do SDDs offer for energy-dispersive X-ray spectroscopy (EDS) in SEM and TEM?
In SEM/EDS, an SDD can support rapid elemental analysis and X-ray mapping, helping users relate detected composition to features in an electron image. For TEM-based EDS, detector placement and instrument geometry affect which X-rays reach the sensor, so system integration matters. In either workflow, consider the elements of interest, peak separation needs, and mapping priorities when assessing EDS performance.