

A microscope that powers on after relocation has not yet demonstrated that it is ready for reliable analysis. Validating SEM performance after a move means comparing post-move operation with a pre-move baseline, using consistent samples and imaging conditions, then documenting any differences before routine work resumes. A dashboard can bring the measurements together, while a clear report helps distinguish a genuine performance change from normal variation.
A familiar instrument should produce familiar results, but moving and reinstalling equipment makes a structured assessment important. This article explains which performance indicators to record, how to compare results meaningfully, and how dashboards and reports can support a sound readiness decision. The goal is a traceable assessment, not just a successful power-up. Consistent records make it easier to identify issues, share findings, and decide whether further evaluation or adjustment is needed.
Key Takeaways
- Compare post-move results with a pre-move baseline using consistent samples and imaging conditions.
- Track relevant performance indicators in a dashboard so changes are easier to identify and interpret.
- Document findings clearly to support decisions about readiness, adjustments, or further evaluation.
- Explore SEM options such as the Cube II Benchtop SEM, Genesis Tabletop SEM, and Veritas Series SEM when assessing equipment needs.
Reasons to measure SEM performance
- Establish a comparison point before relocation. A pre-move baseline gives the post-move assessment a reference. Record the sample, imaging conditions, instrument configuration, and representative outputs used before transport. A saved image with its acquisition settings, for example, can help distinguish an operational change from a setup change. Without that reference, later comparisons rely on memory rather than documented conditions.
- Confirm that the instrument produces consistent results after reinstallation. Powering on confirms that the instrument operates, but not that observations remain comparable. Repeat imaging with the same reference sample and documented conditions. Compare the resulting images and records for differences that could affect interpretation. This makes validating SEM performance after a move a measurement task, not an assumption based on successful startup.
- Separate relocation effects from other changes. A pre-move record helps show whether a difference arose during relocation or reflects a changed sample, configuration, or procedure. Keep the comparison controlled: use the same reference material and reproduce the recorded conditions as closely as possible. When several variables change together, it becomes harder to isolate the cause. A traceable comparison supports focused follow-up.
- Use results to guide follow-up decisions. Record visible differences, operating conditions, and instrument messages alongside the comparison images. A clear record helps determine whether further evaluation or adjustment is appropriate before routine analysis resumes. It also gives operators a shared reference for discussing results. Documenting the outcome prevents one observation from being mistaken for a complete performance assessment.
- Make retesting part of equipment control. According to the U.S. Environmental Protection Agency, retesting is appropriate after a system fails functional testing, after a repair, or periodically. As a disciplined practice, post-move measurement creates a record for later comparisons, including after service or changes to operating conditions. Keep dated results with the corresponding sample and setup details so each assessment has useful context.
Performance metrics
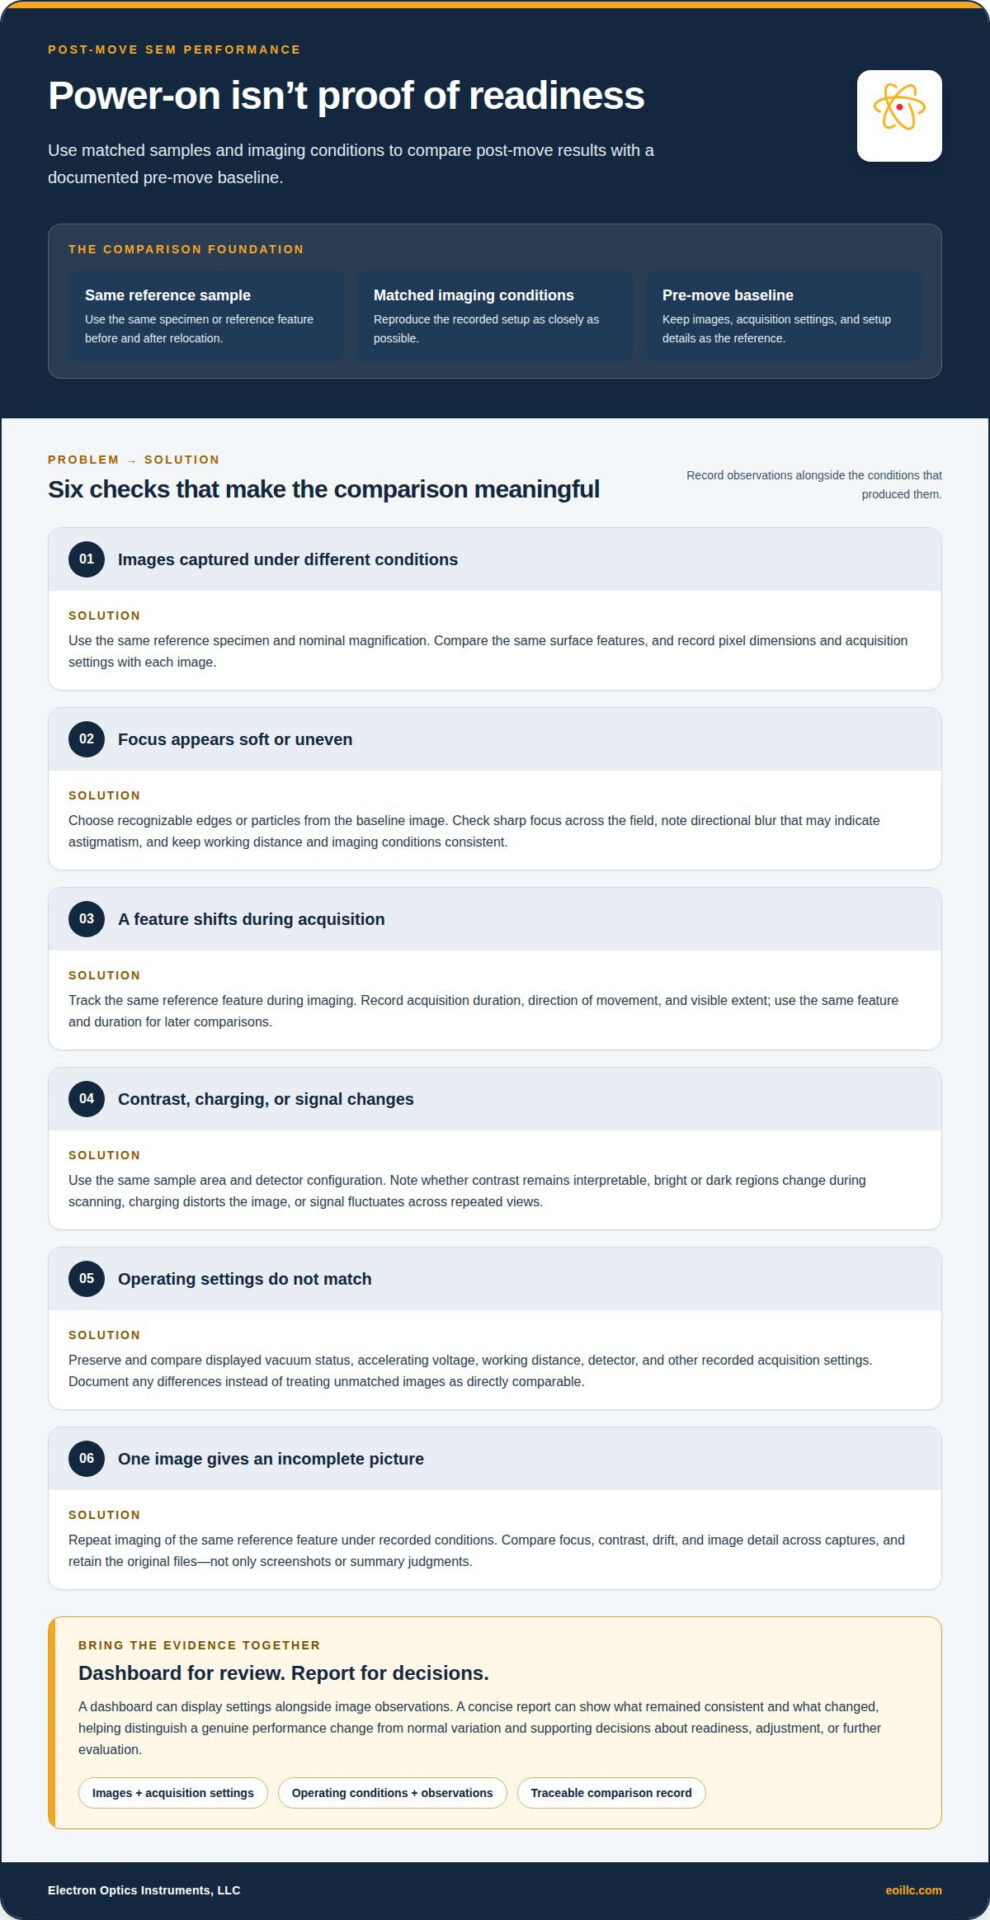
- Compare image detail at a matched magnification. Use the same reference specimen and nominal magnification before and after relocation. Check whether the same surface features remain distinguishable in both images. Record pixel dimensions and acquisition settings with each file, since image size and settings can affect apparent detail. A matched comparison provides better evidence than images captured under different conditions.
- Assess focus and astigmatism using recognizable features. Choose a specimen with edges or particles that are clear in the baseline image. Check whether those features can be brought into sharp focus across the field, and note any directional blur that may indicate astigmatism. Keep the working distance and imaging conditions consistent. Record observations rather than relying on a general impression that the image looks acceptable.
- Track image drift during acquisition. Capture a reference feature, then observe whether its position changes during imaging. Record the acquisition duration and describe the direction and visible extent of movement. Drift can complicate comparisons of fine structures, even when focus appears stable. Using the same feature and duration each time makes changes easier to distinguish from differences in the test procedure.
- Document contrast, charging, and signal stability. Use the same sample area and detector configuration for each comparison. Note whether contrast remains interpretable, whether bright or dark regions change during scanning, and whether charging visibly distorts the image. Record signal fluctuations that affect repeated views of one feature, too. These observations add context to image sharpness and help explain differences between images.
- Record operating indicators alongside every image. Preserve the displayed vacuum status, accelerating voltage, working distance, detector, and other acquisition settings included in the system record. Compare equivalent settings in the pre-move and post-move files. If a setting differs, document it rather than treating the images as directly matched. A dashboard can display these fields alongside image observations for efficient review.
- Check repeatability across a controlled set of observations. Reimage the same reference feature under the recorded conditions and compare focus, contrast, drift, and image detail across captures. Save the original files, not just screenshots or summary judgments. A concise report can show which metrics remained consistent and which changed, providing a traceable basis for further evaluation without treating one image as a complete assessment.
For broader performance evaluation, distinguish model-validation measures from image-acquisition checks. SEM cross-validation may compare cross-validated chi-square, RMSEA, or CFI across data subsets or resampled data sets. When reporting these measures, identify the associated subset or resampled data set and make the comparison basis clear. This lets validation results sit alongside specimen-level observations without treating one kind of evidence as a substitute for another.
If an evaluation also reports impression share, keep that measure separate from image quality and instrument stability. Impression share is calculated by dividing impressions by total eligible impressions. State the measure and its denominator clearly so it is not confused with specimen image observations or operating indicators. These metrics can appear together, provided each remains tied to its stated basis and is interpreted on its own terms.
Evaluate performance
- Define acceptance criteria before reviewing results. Use the laboratory’s documented baseline and analysis requirements to establish what constitutes an acceptable comparison. Criteria might include image usability for a specific specimen or consistency across repeated observations. Record the decision rules before assessing post-move results, so the team does not redefine success after seeing the images. This keeps the evaluation traceable and focused on the work the instrument must support.
- Review the complete record, not a single image. Bring comparison images, acquisition settings, instrument messages, and operator observations together in one dashboard or report. For example, a sharp image accompanied by a warning calls for a different review than a sharp image without one. Check that each result is linked to its sample and conditions. Missing context can make an apparent difference difficult to interpret or reproduce.
- Judge deviations against the baseline and the task. Compare each recorded result with its corresponding pre-move observation, then assess whether the difference affects the intended analysis. A visible change may matter for fine surface detail but not for a broader overview. Apply the same acceptance criteria to each comparison and document why a deviation does or does not affect the study. This connects technical observations to practical readiness.
- Separate repeatable changes from isolated variation. Review repeated observations of the same reference feature before drawing conclusions. If a difference recurs under matched conditions, document it as a pattern for follow-up. If it appears in only one capture, retain the result but distinguish it from consistent findings. Keep the specimen, settings, and evaluation method aligned; changing them together makes cause and effect harder to assess.
- Check the evaluation conditions and state a clear outcome. Confirm that the sample and operating conditions were suitable for the intended comparison. Note deviations from the planned procedure, since they can limit interpretation. Summarize whether the evidence meets the lab’s criteria, points to a concern for further investigation, or remains inconclusive. A useful report identifies the supporting observations and explains the decision, rather than relying on a broad pass-or-fail label.
- Preserve the assessment for the next comparison. Store the report with its images, settings, sample identifiers, and decision rationale. That record gives future evaluations a consistent reference after maintenance or another change in operating conditions. To connect evaluation needs with instrument selection, review SEM equipment options.
That record can also support model checks when SEM analysis is part of the work. SEM validation includes checking for errors and warnings, calculating fit criteria, comparing them with recommended values or thresholds, and adjusting the model if needed. Model fit is commonly evaluated using multiple criteria, including chi-square, RMSEA, CFI, and SRMR. Lower chi-square, RMSEA, and SRMR values and higher CFI values generally indicate better fit.
For SEM model fit, interpret criteria in light of model size and complexity, sample size, and data distribution. Holdout cross-validation evaluates a model by fitting it on one data subset and assessing it on another. SEM validation should combine validation and cross-validation methods and use a large, representative sample.
Electron Optics Instruments, LLC
Electron Optics Instruments, LLC offers SEM equipment for laboratories assessing imaging needs after relocation or planning future instrument requirements. Its range includes the Cube II Benchtop SEM, Genesis Tabletop SEM, Veritas Series SEM, and Veritas Plus SEM. The right system depends on the specimens, imaging objectives, and workflow your laboratory needs to support.
Use the documented post-move assessment to clarify whether your priority is continued operation, a change in imaging capability, or equipment for a different application. That context makes the next discussion practical and focused, without treating a single performance comparison as a substitute for evaluating your laboratory’s broader requirements.
Contact Electron Optics Instruments, LLC to discuss your SEM equipment needs.
Turn Your Assessment Into a Clear Next Step
Validating SEM performance after a move gives you a stronger basis for deciding how the instrument fits into your laboratory’s work. Use the assessment record to identify unresolved issues, clarify the imaging requirements that matter most, and guide future equipment planning. This makes post-move evaluation a useful reference for operational decisions, rather than a one-time exercise.
When results raise questions about SEM equipment or application needs, a focused discussion can help define the next steps. Electron Optics Instruments, LLC offers the Cube II Benchtop SEM, Genesis Tabletop SEM, and Veritas Series SEM. Share your laboratory’s requirements and assessment context with our team to make the conversation relevant to your work.
Contact Electron Optics Instruments, LLC to discuss your SEM requirements and take the next step with confidence.