
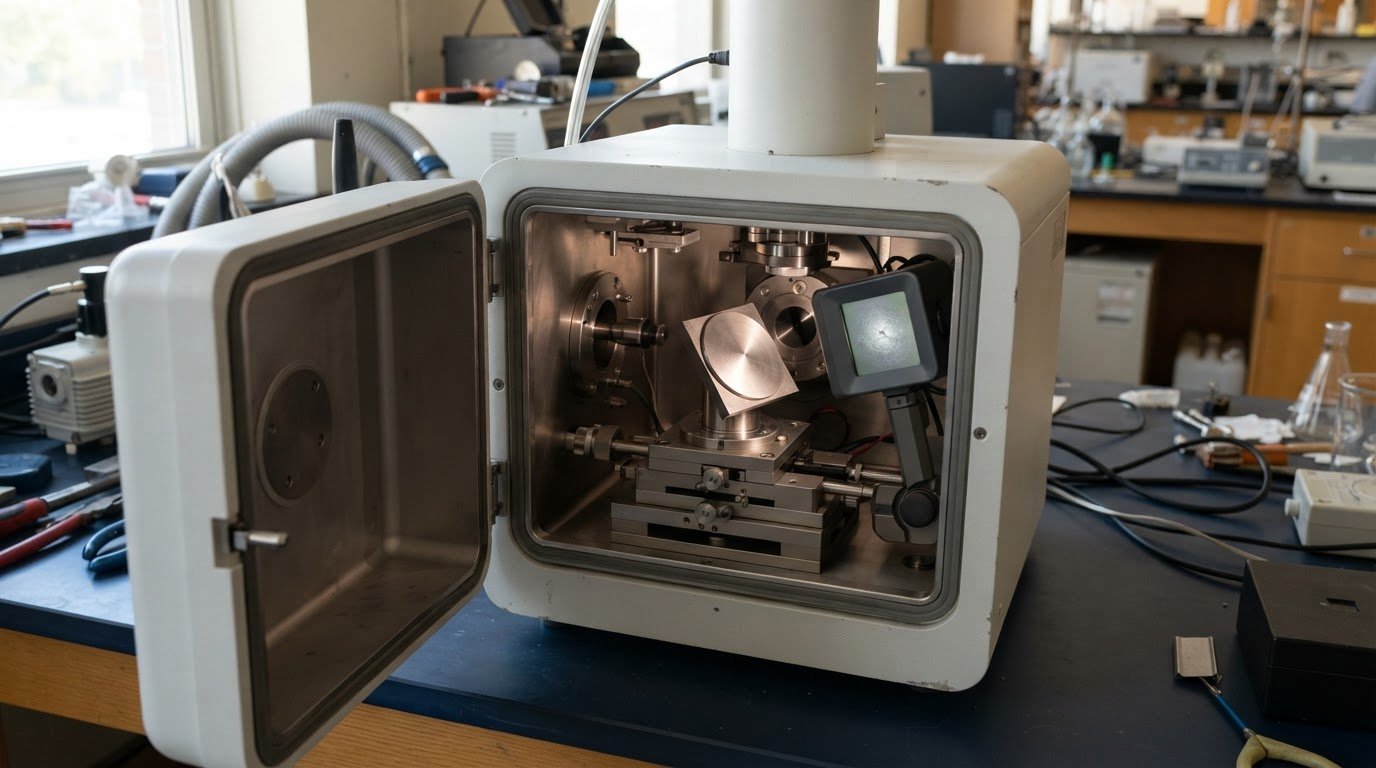
A useful EBSD map depends on more than a sharp image. Getting started with electron backscatter diffraction means understanding how a scanning electron microscope directs a beam onto a tilted crystalline sample: electrons interact with its crystal lattice, producing diffraction patterns that software indexes to reveal phase and orientation. Scanning the region turns those patterns into maps of grains, boundaries, and crystallographic texture.
Sample condition is central to the result. Surface damage, contamination, or uneven preparation can weaken or distort diffraction patterns and reduce the information available for indexing. Preparation is not just a final handling step; it affects how clearly the data represent the material’s structure.
This introduction covers the physical principles behind EBSD, sample preparation, and conditions that can degrade patterns during acquisition. It also explains how indexed orientation data reveal texture, helping you connect maps to the material questions you need to answer.
Key Takeaways
- Understand how diffraction patterns form when an electron beam interacts with a crystalline sample, and how indexing translates them into phase and orientation maps.
- See why sample-surface condition and preparation influence pattern quality, and which sources of damage or contamination can interfere with acquisition.
- Learn how EBSD orientation data reveal crystallographic texture, grain relationships, and boundary distributions across a selected region.
- Use the article’s practical context to assess whether a benchtop or tabletop SEM could support your materials-characterization needs.
What are best practices for EBSD sample preparation?
For reliable EBSD mapping, prepare a flat, polished sample surface with minimal deformation and contamination. Surface quality matters because an EBSD pattern needs clear diffraction bands for software indexing. In materials science, this helps phase and orientation maps represent the crystal structure rather than preparation damage. The results can show how crystal orientation varies between grains and how phases are distributed.
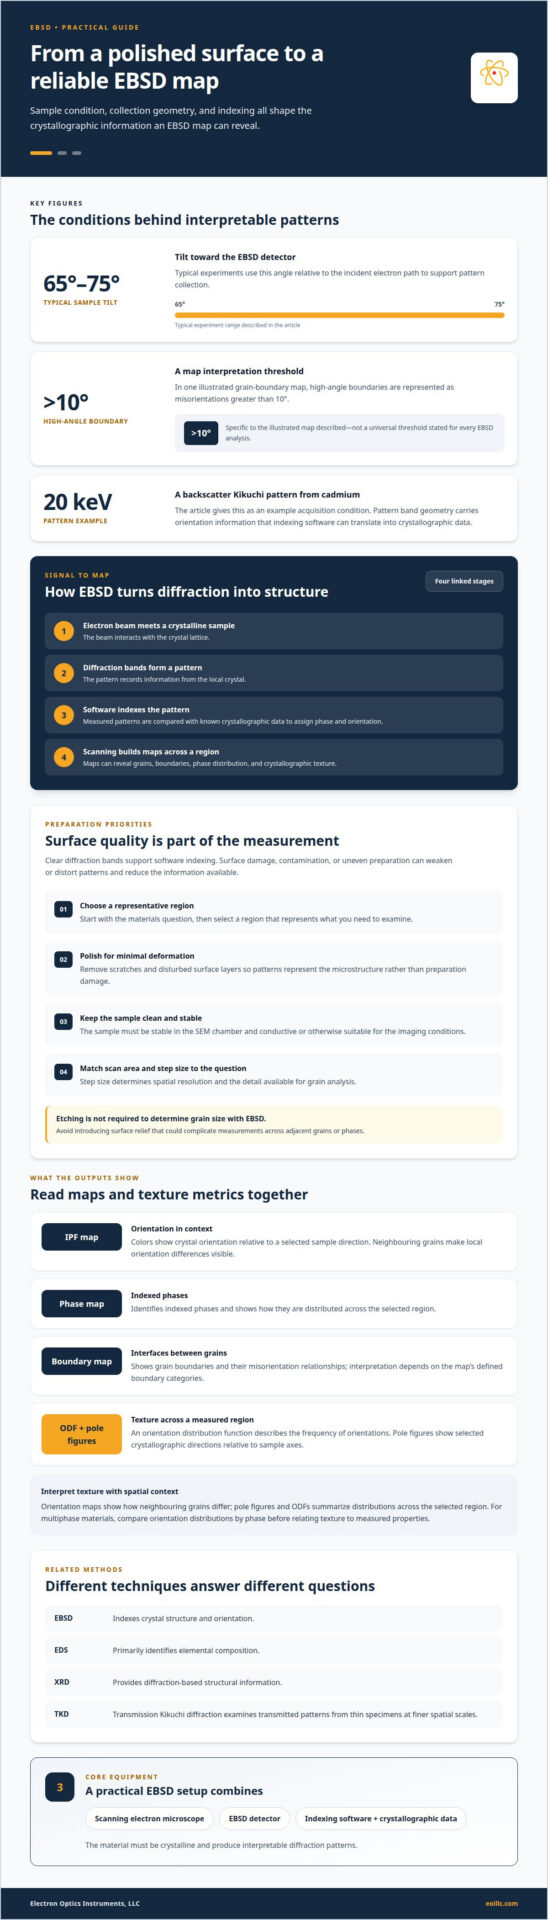
Preparation begins with the analysis question: select a representative region, then polish it to remove scratches and deformation that obscure crystallographic detail. The sample must also be stable in the SEM chamber, and conductive or otherwise suitable for the imaging conditions. During acquisition, the sample is typically tilted between 65° and 75° relative to the incident electron path. This geometry supports pattern collection, while scan step size determines spatial resolution and the detail available for grain analysis.
What equipment and sample preparation are needed? EBSD uses a scanning electron microscope, an EBSD detector, and indexing software with crystallographic data. Prepare a clean, polished surface, then select a scan area and step size suited to the features you want to measure. The material must be crystalline and produce interpretable diffraction patterns.
How does EBSD compare with EDS, XRD, and transmission Kikuchi diffraction? EDS primarily identifies elemental composition, while EBSD indexes crystal structure and orientation. XRD provides diffraction-based structural information, and transmission Kikuchi diffraction examines transmitted patterns from thin specimens at finer spatial scales. These methods address related but distinct materials questions.
How much does EBSD instrument access or analysis typically cost? Cost depends on the project and is provided after a quote request. Instrument access, preparation requirements, acquisition time, and analysis scope all affect the work involved.
How do you interpret IPF, phase, and grain-boundary maps? An IPF map uses colors to show crystal orientation relative to a selected sample direction; a phase map identifies indexed phases. Grain-boundary maps show interfaces, with high-angle boundaries represented as misorientations greater than 10° in one illustrated map.
What EBSD software and beginner tutorials are available? EBSD software compares measured patterns with known crystallographic data to assign phase and orientation. Start with tutorials on pattern indexing, map legends, and grain-boundary interpretation, then relate each output to the materials question you are investigating.
Crystallographic texture determination
EBSD texture analysis uses indexed crystal orientations to show how grains are arranged relative to a sample direction. The resulting orientation distribution helps connect microstructure with material properties.
Texture Metrics
Texture metrics quantify how strongly crystal orientations cluster or spread across a measured region. An orientation distribution function (ODF) describes the frequency of orientations, while pole figures show selected crystallographic directions relative to sample axes. For researchers getting started with electron backscatter diffraction, these metrics help distinguish preferred orientations from broadly distributed grain populations.
For example, compare pole figures from two regions of rolled metal to assess whether their preferred orientations differ. Texture strength and component distribution can then be related to direction-dependent properties, such as deformation behaviour. The analysis is most useful when the measured area and sample reference directions match the materials question.
Crystal Diffraction Patterns
Each crystal diffraction pattern records bands formed as the electron beam interacts with a local crystal lattice. Indexing software compares patterns with known crystallographic data and assigns orientations that can be compiled into maps. A backscatter Kikuchi pattern from cadmium, for example, was acquired at 20 keV.
The pattern’s band geometry carries orientation information; accurate indexing turns that signal into texture data. When getting started with electron backscatter diffraction, review pattern quality and phase selection before interpreting an orientation distribution, since indexing errors can distort the result.
Texture maps provide spatial context that a single summary metric cannot. Orientation maps show how neighbouring grains differ, while pole figures and ODFs summarize distributions across the selected region. In multiphase materials, compare orientation distributions by phase before relating texture to measured properties. If your study also requires suitable SEM instrumentation, explore SEM systems for materials analysis as a possible next step.
Sample preparation and pattern degradation
EBSD pattern quality depends on surface condition and measurement geometry. The electron-sample interaction and detector arrangement also shape the signal.
For SEM setup, tilt the sample toward the EBSD detector and position the region of interest for pattern collection. Typical experiments use a 65° to 75° tilt relative to the incident electron path.
Preparation and Etching
EBSD preparation produces a polished surface with minimal deformation, so crystal patterns reflect the microstructure rather than preparation damage. Scratches and disturbed surface layers can weaken patterns and compromise indexing. EBSD can determine grain size without etching to reveal grain boundaries, so etching is not required for that measurement. Avoid introducing relief that could complicate measurements across adjacent grains or phases.
Rough or Non-Flat Samples
Rough or curved surfaces change local sample geometry and affect how diffraction signals reach the detector. Height variations across the region of interest can also make pattern quality and indexing less consistent. For meaningful grain-distribution data, prioritize a flat analysis area and keep the target boundary within the detector’s view. If topography is part of the study, interpret local pattern changes alongside the surface geometry.
Sample Tilt and Measurement Geometry
Sample tilt directs backscattered electrons toward the detector and influences the collected pattern. Typical EBSD experiments tilt the sample between 65° and 75° relative to the incident electron path. A higher tilt increases backscattered-electron yield and improves diffraction pattern quality, but reduces spatial resolution. Select geometry with the feature size and measurement area in mind, especially when resolving a narrow grain boundary.
At each beam position, electrons interact with the crystal lattice and produce a pattern from a shallow sample volume. Contamination can weaken that signal: carbon deposition degraded a pattern after a 3-hour acquisition at a highly magnified location around a deformation twin in duplex stainless steel ferrite. For long measurements, monitor pattern quality at the region of interest; gradual degradation can affect later points in the map.
Electron backscatter diffraction principles
EBSD converts electron diffraction into spatially resolved crystallographic information. Its central principle is that electron diffraction patterns reflect the crystal structure and orientation of the material. A scanning electron microscope can be used to generate diffraction patterns that provide information about crystal structure and orientation. This makes the technique useful when phase identification and grain relationships matter alongside imaging.
The interaction begins where the electron beam strikes the specimen. Electrons scatter from the periodic atomic arrangement, and some emerge as backscattered electrons that form diffraction bands. An EBSD pattern represents a crystal volume approximately 20 nm deep, multiplied by the projected area of the incident beam. That interaction volume defines a practical scale for interpreting the signal, although the mapped area and scan spacing also shape spatial detail.
Geometry determines how much useful signal reaches the detector. The detector is inclined approximately 70° relative to the normal incidence of the electron beam, while the sample is tilted toward it. This configuration supports collection of Kikuchi patterns. The measured pattern is then compared with known crystallographic data; indexing assigns a phase and orientation to each beam position. A sequence of indexed positions can produce maps across the region present in the field of view.
Interpretation depends on the question. For phase identification, compare indexed structures across the sample; for orientation, examine how crystal axes vary relative to a chosen reference direction. A scan across a grain boundary can show the change between neighbouring orientations, while a larger map can reveal grain distribution and texture. These outputs support materials-science applications, including analysis of microstructure and properties linked to crystallographic arrangement.
EBSD differs from a conventional image because contrast alone isn’t the final result. The indexed Kikuchi pattern connects a local electron-sample interaction to crystallographic information. Mechanical preparation and suitable geometry help preserve interpretable patterns, but the key takeaway is that every map depends on both the recorded signal and the indexing model. To explore SEM systems suited to materials analysis, review SEM system options.
Electron Optics Instruments
Electron Optics Instruments, LLC can help you consider SEM equipment as you plan materials characterization and an EBSD workflow. Its offerings include the Cube II Benchtop SEM, Genesis Tabletop SEM, Veritas Series SEM, and Veritas Plus SEM for industrial and research applications.
Turn to Electron Optics Instruments, LLC when evaluating SEM options for a project involving crystalline samples, orientation mapping, or grain analysis. The right equipment depends on the sample, the measurements required, and the imaging workflow. The principles in this article provide a foundation for discussing how SEM capabilities align with your research or production needs.
Contact Electron Optics Instruments, LLC to discuss SEM equipment and support for your work.
Carry Your EBSD Study into the Next Stage
Getting started with electron backscatter diffraction is most productive when your measurement plan follows a clearly defined materials question. Before selecting an imaging path, identify the decisions the data must support, such as comparing regions, characterizing a component, or evaluating crystallographic variation. That focus helps shape a practical discussion about SEM capabilities and how they fit your research or production requirements.
Electron Optics Instruments offers SEM options for industrial and research applications, including the Cube II Benchtop SEM, Genesis Tabletop SEM, and Veritas Series SEM. The company also provides service and support to help you consider how microscopy equipment can fit into a materials-characterization workflow.
As your study develops, treat EBSD as one part of a broader measurement strategy: connect the required information to the sample, analysis goals, and instrument configuration. A well-defined question makes the next equipment discussion more useful and focused. Contact Electron Optics Instruments to discuss SEM equipment for your application, and move forward with a clear foundation for your work.
Frequently Asked Questions
How Does EBSD Work?
EBSD records diffraction information from crystalline regions inside a scanning electron microscope. Indexed measurements can be assembled into maps that distinguish phases and show how crystal orientations vary across a sample. For example, a materials scientist can compare orientation changes on either side of a boundary to investigate local microstructure, rather than relying only on image contrast or composition.
Can EBSD be combined with other electron microscopy techniques?
Yes. EBSD can be paired with SEM imaging and energy-dispersive X-ray spectroscopy (EDS), so structural and compositional information can be considered together. EDS identifies elements, while EBSD adds crystallographic information. This distinction is useful when composition alone cannot resolve structural differences. For example, EBSD can help distinguish iron oxide phases such as wüstite, magnetite, and hematite when EDS provides insufficient structural information.
Can EBSD be performed on rough or non-flat samples?
It can be attempted, but topography can complicate pattern collection and indexing. A raised feature may change the local detector geometry, while a depression can reduce the signal from an area of interest. If a component cannot be made flat, interpret the map in light of its surface shape and distinguish genuine orientation changes from areas where pattern quality or indexing is affected.
How long does EBSD acquisition take?
Acquisition time depends on map area, scan spacing, pattern quality, and instrument settings, so a small targeted scan differs from a dense map. Indexing capacity alone doesn’t determine total measurement time: the electron beam must visit each scan point, and stage motion and pattern capture contribute. EBSD systems can index more than 4,500 patterns per second, but that rate isn’t a map-duration estimate.
Is EBSD destructive?
EBSD analysis does not inherently consume a bulk sample, but preparing a surface can modify it through polishing or other finishing steps. The practical concern is whether those steps alter a feature needed for later testing or examination. For a failure-analysis specimen, for example, preserve relevant fracture or damage regions and select an EBSD area that addresses the crystallographic question without compromising other evidence.
What are Kikuchi patterns and how are they formed?
Kikuchi patterns are diffraction features recorded when backscattered electrons interact with regularly arranged atoms in a crystal. The resulting bands reflect the lattice geometry and orientation at the beam position. Indexing software compares their positions with crystallographic reference data to assign an orientation. Differences between patterns collected at neighbouring points can reveal changes across grains or phases.