
What if the clearest SEM image still produces a misleading particle size distribution? High-resolution images reveal particle boundaries and morphology, but they can’t compensate for unrepresentative sampling or inconsistent segmentation. A particle size distribution analysis SEM workflow depends as much on how images are selected and interpreted as on the instrument used.
If you’re uncertain where one particle ends and another begins, or whether to report a number-based or volume-based distribution, those are central measurement decisions, not minor software settings. The same is true of choosing fields of view: carefully measured particles may still fail to represent the bulk sample if preparation or image selection introduces bias.
This guide explains how to turn SEM images into a transparent, repeatable distribution, from sample preparation and boundary rules to particle metrics and image analysis. You’ll learn where SEM is particularly useful, how to distinguish number-based from volume-based results, and how to assess whether your images adequately represent the sample. The aim is to produce a distribution that supports sound conclusions without claiming more than the data show.
Key Takeaways
- SEM particle sizing measures dimensions from selected two-dimensional particle images, so define what you intend to measure before analyzing them.
- A repeatable workflow combines representative sample preparation and consistent image acquisition with clear segmentation and reporting rules.
- SEM image analysis can help answer questions about particle shape, agglomeration, and visible features that a size distribution alone may not capture.
- Reliable particle size distribution analysis sem depends on representative field selection, calibration, and transparent documentation, not image resolution alone.
- Match SEM capabilities and operating settings to the sample, particle size range, field of view, and measurement objective.
What Particle Size Distribution Analysis with SEM Actually Measures
Scanning electron microscopy (SEM) particle sizing measures selected dimensions from particle images. In routine image analysis, those dimensions describe two-dimensional projections of particles on a substrate, not their complete three-dimensional geometry. A particle’s apparent size can therefore depend on its orientation, how it rests on the substrate, and whether it overlaps or touches neighboring particles.
The resulting distribution summarizes the measured image metrics for the particles included in the analysis. The median is the midpoint of those measurements; percentiles show the values below which specified portions of the measured population fall. The observed range runs from the smallest to the largest recorded value, while distribution width indicates how broadly measurements are spread. These statistics are meaningful only alongside the metric and weighting basis used. For a foundational overview of the concept and common measurement approaches, see Understanding Particle Size Distribution.
Which particle size metrics can SEM image analysis report?
Equivalent circular diameter converts a particle’s projected area into the diameter of a circle with the same area. It provides a consistent area-based descriptor, but doesn’t preserve details of an irregular outline. Feret diameter measures the distance between parallel tangents to the particle boundary. Maximum and minimum Feret diameters can help characterize elongated or irregular projections, where a single area-derived value may conceal directional differences. Choose the metric that matches the particle shape and research question, and state it clearly in the results.
Number-based and volume-based distributions are not interchangeable
Counting each segmented particle and sorting its measured dimension produces a number-based distribution: each detected particle contributes one observation, regardless of size. This directly describes the particles counted in the images. It does not automatically describe how much material each size class contributes by volume.
A volume-weighted estimate requires additional calculations, typically using particle dimensions to infer volume. Because a two-dimensional image doesn’t provide full geometry, those calculations depend on assumptions about particle shape and three-dimensional dimensions. Identify such results as inferred estimates, not direct image measurements.
The distinction can materially change interpretation. A small number of large particles may account for a substantial share of estimated volume while representing only a small fraction of the counted population. Conversely, numerous fine particles can dominate a number-based result without contributing the largest estimated volume. For defensible particle size distribution analysis SEM, report whether the output is number-based or volume-weighted, name the measured dimension, and disclose assumptions used for any conversion.
SEM directly measures image-derived dimensions; conclusions about bulk behavior require assumptions about sampling, particle geometry, and how the imaged population represents the material. A precise measurement of selected projections does not, by itself, prove that the entire sample has the same distribution. Keep that distinction explicit so readers can interpret medians, percentiles, ranges, and distribution width without treating estimates as direct three-dimensional observations.
How SEM Images Become a Particle Size Distribution
Turning micrographs into a defensible distribution requires a defined measurement procedure, not simply an image and analysis software. In particle size distribution analysis SEM, decisions made before imaging determine which particles can be detected, while segmentation and reporting rules determine how those particles contribute to the results. A repeatable workflow makes these choices visible.
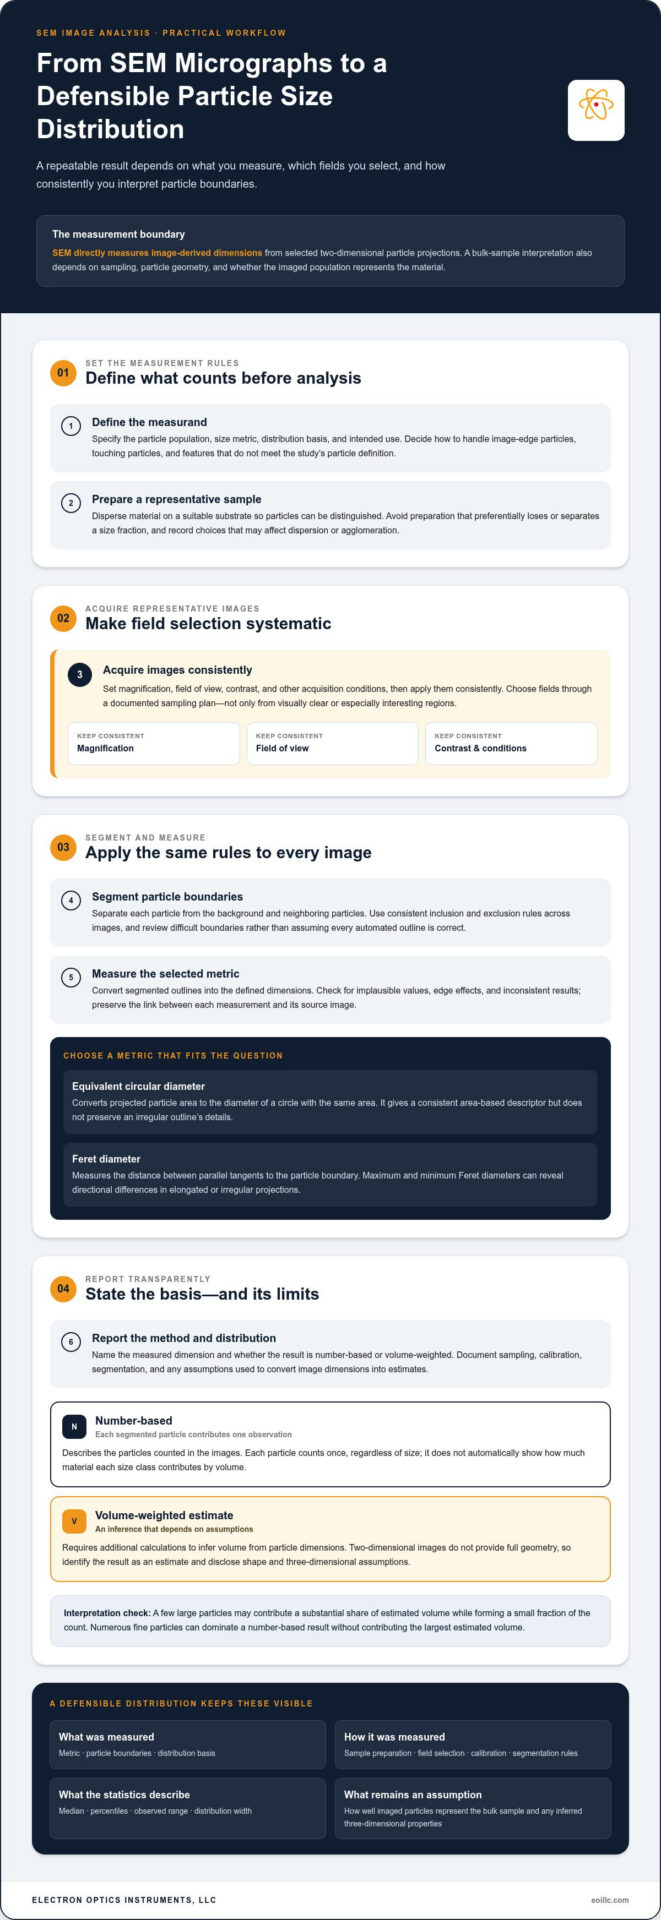
- Define the measurand. Specify the particle population, size metric, distribution basis, and intended use. Decide in advance how to handle particles at image edges, touching particles, and features that don’t meet the study’s definition of a particle.
- Prepare representative samples. Disperse the material on a suitable substrate so individual particles can be distinguished, while avoiding preparation that preferentially loses or separates a size fraction. Record preparation choices that could affect observed dispersion or agglomeration.
- Acquire images systematically. Set magnification, field of view, contrast, and other acquisition conditions, then apply them consistently. Select fields through a documented sampling plan rather than choosing only visually clear or especially interesting regions.
- Segment particles. Separate each particle boundary from the background and neighboring particles. Apply the same inclusion and exclusion rules across images, and review difficult boundaries instead of treating every automated outline as correct.
- Measure the selected metric. Convert segmented outlines into the defined dimensions, then check for implausible values, edge effects, or inconsistent results. Preserve the link between measurements and the images from which they were obtained.
- Report the method and distribution. State the metric, weighting basis, sample-preparation approach, image-selection method, calibration, segmentation rules, and relevant exclusions alongside the reported statistics.
Image acquisition and scale calibration
Calibration converts image pixels into physical dimensions, allowing a boundary measured in pixels to be expressed in units such as micrometers or nanometers. Retain calibrated scale information with every analyzed image, along with acquisition settings and image identifiers. Choose fields of view that capture the particles relevant to the measurement, including distribution tails, rather than repeatedly imaging only the most convenient size range. Inconsistent scale or unsuitable contrast can make comparisons unreliable.
Magnification alone doesn’t establish comparability. Scale calibration and consistent imaging conditions are essential to interpreting a measured boundary. Exposure, focus, detector conditions, and contrast can affect how clearly particle edges appear, so record and control these settings as part of the procedure.
Segmentation, particle separation, and measurement
Thresholding can identify particles by separating image intensities, while manual review lets an analyst correct ambiguous outlines. These are distinct analysis choices, not universally interchangeable solutions. Touching particles may be merged into one object; pores, debris, and image artifacts may be mistaken for particles or distort their measured boundaries. Document exclusion rules and inspect representative segmentation overlays, especially in crowded or irregular regions.
For further context on image-based estimation and its analysis challenges, consult NIST on SEM Image Analysis for Particle Sizing. Consistent image acquisition and analysis also depend on suitable instrumentation and laboratory practices. SEM systems and laboratory support from Electron Optics Instruments, LLC can support a repeatable workflow.
When SEM Particle Sizing Is More Useful Than Other Methods
Choose a method based on the question being asked. If the priority is a population-level size distribution or coarse material grading, industrial screening solutions from manufacturers like Compass Wire Cloth Corporation and other bulk techniques can provide an efficient overview. If the question is whether particles are elongated, joined in agglomerates, or visually distinct from debris, SEM image analysis adds evidence that a single distribution curve cannot show. Neither method is universally superior: each measures particles differently and has its own interpretation limits.
Questions SEM can answer through direct particle imaging
SEM images let analysts inspect projected particle shape, surface features, and associations between neighboring particles. That visual record can help distinguish a genuine irregular particle from a segmentation error or flag an unusual feature for closer review. It also supports targeted comparisons, such as whether a population includes visibly elongated particles. Image appearance alone, however, doesn’t establish chemical identity or composition. Morphology evidence and compositional analysis are different forms of evidence.
Direct imaging has limits. SEM analysis covers selected fields rather than every particle in the bulk sample, so field selection and sample preparation affect how representative the measured population is. Images also show two-dimensional projections, not complete three-dimensional geometry. These limits matter when inferring bulk behavior from particle-level observations. Particle size distribution analysis SEM is especially informative when individual morphology is part of the decision, not merely when a size value is needed.
How SEM compares with laser diffraction
Laser diffraction measures the pattern of light scattered by a dispersed ensemble of particles and uses an optical model to infer a size distribution. The result represents a population-level measurement, but interpretation depends on factors including the model and assumptions used to relate scattering to particle size. SEM instead derives measurements from selected, visible image fields, allowing particles to be counted and their outlines inspected directly.
| Consideration | SEM image analysis | Laser diffraction |
|---|---|---|
| Measurement basis | Dimensions measured from particle projections in images | Size inferred from a particle population’s light-scattering pattern |
| Useful output | Image-based dimensions with visible shape and association | Model-derived population distribution |
| Useful question | What do individual particles look like, and are they associated? | What is the overall size distribution of the dispersed population? |
| Key limitation | Selected fields and two-dimensional projections | Interpretation depends on optical and particle-model assumptions |
Use SEM when particle-level morphology, visible agglomeration, or inspection of selected features is central to the analysis. Laser diffraction may better suit questions focused on the overall distribution of a dispersed population. If both bulk distribution and particle-level morphology matter, the methods can complement each other. Compare their results as outputs from different measurement principles, not as interchangeable readings. Differences may reflect sampling, dispersion, shape, or model assumptions, and should prompt interpretation rather than an automatic conclusion that one method is wrong.
How to Improve Repeatability and Report SEM Particle Sizing
A repeatable distribution depends on how particles are presented, images are acquired, and boundaries are interpreted. Differences in deposition, image settings, or exclusion rules can change which particles enter the dataset, so consistency needs to extend from preparation through reporting. Repeatability requires consistent image acquisition and transparent analysis decisions.
Use this checklist to make the workflow easier to reproduce:
- Select fields using a planned approach across the sample, rather than choosing only clear or visually appealing regions.
- Keep magnification, scale calibration, contrast, and other relevant acquisition settings consistent across analyzed images.
- Apply the same segmentation method and particle inclusion or exclusion rules throughout the analysis.
- Record image identifiers, calibration details, preparation steps, and analysis settings so the process can be reviewed.
- Check how particle count, field selection, and agglomeration influence the distribution before drawing conclusions.
These controls support particle size distribution analysis SEM by helping distinguish actual sample variation from changes introduced by the imaging or analysis procedure.
Control sampling and particle preparation
Nonrepresentative deposition can overemphasize one size fraction, while overlapping particles may be measured as a single object or excluded, shifting the observed population. Decide whether an agglomerate is the feature of interest or whether the objective is to measure separable primary particles. Define how ambiguous clusters will be handled and apply that rule consistently. For preparation-specific guidance, consult the SEM sample preparation guide.
Validate and communicate the distribution
Review segmentation overlays across representative images, including crowded fields and particles near inclusion limits. Check that boundaries remain credible when contrast or particle shape varies, and record any manual corrections. Image quality can affect boundary detection, so the guidance on best practices for high-quality SEM imaging provides useful context for evaluating acquisition conditions.
A report should let another analyst understand what the distribution represents, not just view a histogram. State the size metric, whether the distribution is number-based or otherwise weighted, sample preparation, the number of images analyzed, and the segmentation and exclusion rules. Note relevant uncertainty sources, such as uneven deposition, overlap, ambiguous boundaries, or limited field coverage. If results change materially when a reasonable analysis choice changes, describe that sensitivity rather than presenting one value as definitive.
Electron Optics Instruments, LLC supports consistent laboratory workflows with SEM systems, training, maintenance, and repair.
Selecting SEM Capabilities for Particle Size Distribution Work
Instrument selection should begin with the measurement task, not a general preference for higher resolution or faster imaging. The right SEM setup must make the smallest feature of interest measurable while supporting images and workflows that produce useful, consistent data. Consider the full process, from sample placement and field selection to image review and analysis.
Match instrument requirements to the measurement task
Start by identifying the smallest particle or feature that must be distinguished, then consider whether image quality and scale calibration can support that measurement reliably. Also assess the field of view needed to capture relevant particles, the number of images your workflow requires, and the time analysts can allocate to acquisition and review. Broader operational considerations are covered in this SEM operation professional guide.
These requirements can compete. A narrow field may show fine detail but capture fewer particles per image, while a wider field can improve coverage but may not resolve the smallest feature of interest. Throughput also depends on how images are collected and analyzed, not only on the instrument. For particle size distribution analysis SEM, evaluate whether the entire workflow can consistently capture, calibrate, and measure the target population.
- Particle size range: Can the imaging conditions distinguish the smallest feature that matters to your question?
- Field of view: Does each image capture enough of the sample to support the planned sampling strategy?
- Image quality: Are particle edges and relevant features clear enough for reliable segmentation?
- Throughput: Can the expected image and review workload fit the laboratory’s routine?
- Analysis workflow: Can operators retain calibrated images and apply consistent measurement rules?
Performance depends on the sample, its preparation, and the measurement objective. A system suited to one material or feature scale may not suit another, so assess instrument capabilities against defined analytical requirements rather than assuming a single specification determines suitability.
Build a sustainable in-house SEM workflow
In-house capability depends on more than equipment. Staff training helps establish consistent acquisition habits, calibration practices, and image-review procedures, while maintenance and repair support contribute to ongoing laboratory operation. Electron Optics Instruments, LLC provides SEM equipment, training, maintenance, and repair support. The Cube II Benchtop SEM is one instrument option to assess against the laboratory’s measurement requirements.
A practical evaluation should connect the instrument, operator workflow, and sample-analysis objective. This keeps particle sizing grounded in what the images can reliably show and helps avoid investing in capabilities that don’t address the measurement task. For laboratories assessing an in-house system, explore SEM systems and support as a next step in evaluating requirements.
Turn Measurement Requirements Into a Repeatable SEM Workflow
Translate your measurement objective into practical laboratory requirements: identify the particle features that matter, determine how images will be collected and reviewed, and establish how results will be documented for future comparison. This creates a clear basis for evaluating an SEM and planning the training and upkeep that help sustain consistent operation. The instrument is one part of the workflow; disciplined methods and capable operators give particle size distribution analysis SEM its practical value.
Electron Optics Instruments, LLC brings more than 30 years of electron microscopy industry experience and serves as the national U.S. distributor of EmCraft SEMs. Its support includes SEM equipment, training, preventative maintenance, and repair. These capabilities help laboratories assess how instrumentation and operational support fit their measurement goals.
Align your analytical needs with an SEM system and support approach suited to your laboratory. Explore SEM systems and support for your laboratory to plan a measurement workflow around clear objectives and repeatable practice.
Frequently Asked Questions
Can SEM measure the size of individual particles?
Yes. SEM image analysis can measure individual particle dimensions once the image scale is calibrated and the particle boundary can be identified. For example, an analyst can record dimensions particle by particle to investigate whether unusually large objects are isolated exceptions or part of a broader population. The result describes the visible projection, so record the chosen metric and don’t interpret that measurement as a complete three-dimensional size.
Is SEM particle size distribution number-based or volume-based?
Direct counts of segmented particles produce a number-based distribution, where each measured particle contributes one observation. A volume-based result requires an additional calculation and assumptions about particle geometry; it isn’t simply another label for the same count data. Check the software’s selected weighting and exported report fields before comparing results between studies, particularly if one report describes a particle count and another presents estimated material volume.
How many particles should be measured for an SEM particle size distribution?
There’s no single count that guarantees a representative result. Guidance summarized for this method suggests measuring roughly 300 to 700 particles depending on the distribution, with about 500 often used as a planning point. A population with a sparse coarse tail may need additional fields to capture uncommon large particles. Compare successive batches of fields to see whether adding observations materially changes the distribution.
Can SEM distinguish primary particles within an agglomerate?
Sometimes, if the image shows clear boundaries between the constituent particles. If primary particles overlap in projection or are fused together, an SEM image may not provide enough evidence to separate them reliably. Define whether the analysis treats a cluster as one measured object or attempts to count visible constituents, and apply that rule consistently. If boundaries remain ambiguous, document the limitation rather than assigning uncertain outlines.
How does SEM particle sizing compare with laser diffraction?
SEM derives dimensions from visible particle images, while laser diffraction measures scattered light from a dispersed population and calculates a size distribution using a model. Consider the decision the result must support: investigating the shape of an unusual contaminant calls for direct visual evidence, while monitoring a dispersed batch’s overall distribution may favor a population-level measurement. If comparing both, align sample condition and interpret differences in light of their distinct measurement principles.
Does EDS analysis measure particle size?
No. EDS detects characteristic X-rays to provide information about the elements present in the region being analyzed; it does not independently measure particle dimensions. An analyst can use SEM images to measure particles and EDS results to investigate elemental composition, keeping the two outputs distinct in the report. For example, elemental information may help assess whether visually similar particles belong to different material types.
Can one SEM image represent the particle size distribution of an entire sample?
Usually, a single image isn’t enough to establish that an entire sample has the same distribution, especially if particles are unevenly deposited or the material is heterogeneous. One field can help test imaging conditions or reveal a feature worth investigating, but it may miss uncommon sizes or local variation. Use a documented field-selection plan across the prepared sample, and state the image coverage when interpreting results.
Ready to assess an SEM workflow for your laboratory? Explore Electron Optics Instruments’ SEM systems and support.