
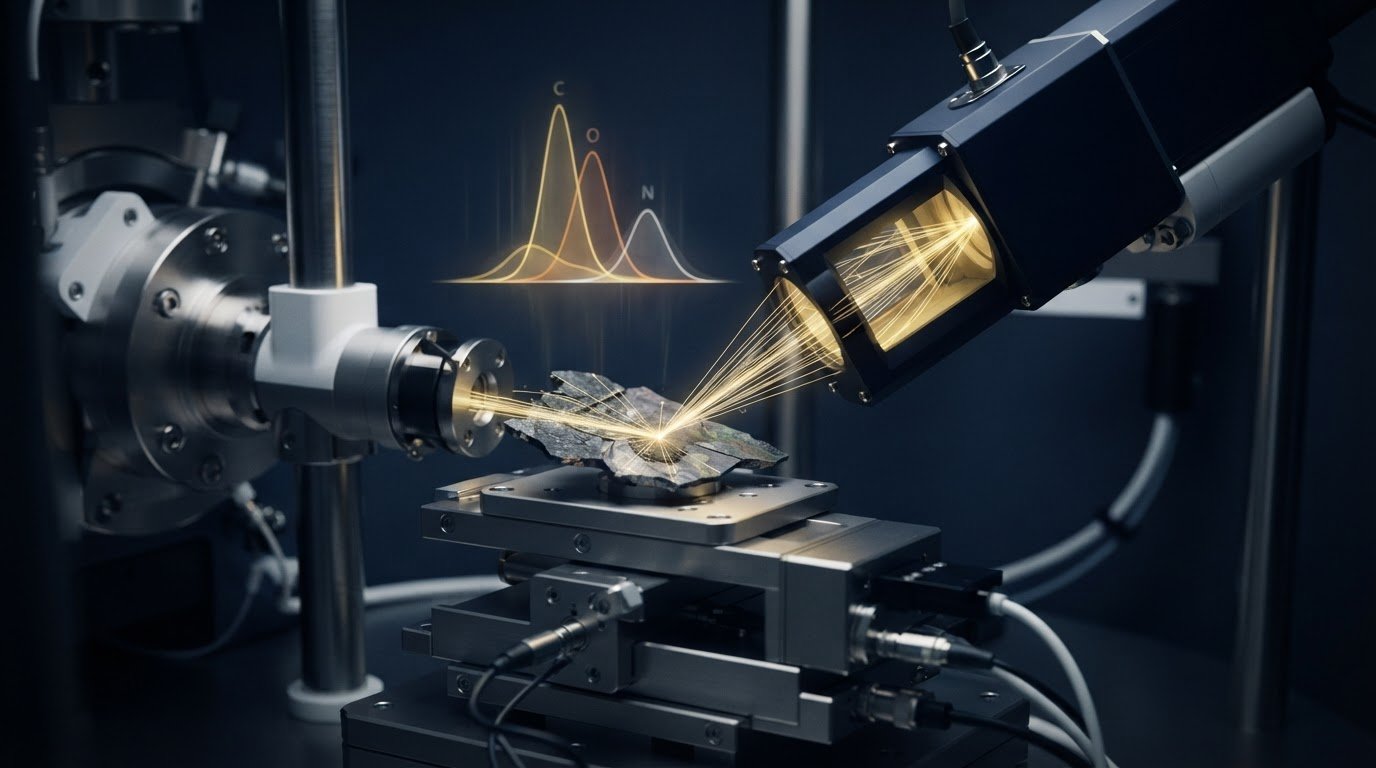
A detector that registers low-energy X-rays does not guarantee a reliable light-element result. In light element detection with eds, the signal must pass through the sample and reach the detector with enough intensity to stand out from background and overlapping peaks. A weak or ambiguous result may reflect the entire measurement setup, not just the detector.
It is understandable to expect a more sensitive detector to resolve the problem. Detector design matters, but so do sample composition and preparation, surface condition, beam settings, collection geometry, and acquisition time. These factors affect how confidently results can be interpreted and compared, and whether a quantified concentration is defensible.
This article explains the physical limits of light-element analysis and practical ways to improve signal quality without overstating certainty. It covers detector windows, sample and instrument conditions, and peak overlaps, then explains when standards-based quantification or a complementary technique such as WDS or EELS may be more appropriate. The goal is to help you assess the full measurement chain and choose an analytical approach suited to the question your sample needs to answer.
Key Takeaways
- Distinguish a detectable X-ray signal from confident element identification and reliable concentration measurement.
- Assess detector window design, collection geometry, and SEM conditions when planning light element detection with eds.
- Match EDS, WDS, or EELS to your analytical question, sample requirements, and need for detail.
- Document sample preparation, coating, composition, and storage to support defensible interpretation of low-energy signals.
- Compare EDS system options against your sample types, workload, reporting needs, and operator workflow.
What Light Element Detection with EDS Measures, and Why It Can Be Difficult
Light element detection with eds measures characteristic X-rays generated when the electron beam in a scanning electron microscope (SEM) interacts with a sample. If the beam ejects an inner-shell electron, an electron from a higher energy level can fill the vacancy and release energy as an X-ray. Each element has characteristic X-ray energies, so an energy-dispersive detector can collect a spectrum for elemental analysis. The Energy-dispersive X-ray spectroscopy overview explains this foundational interaction.
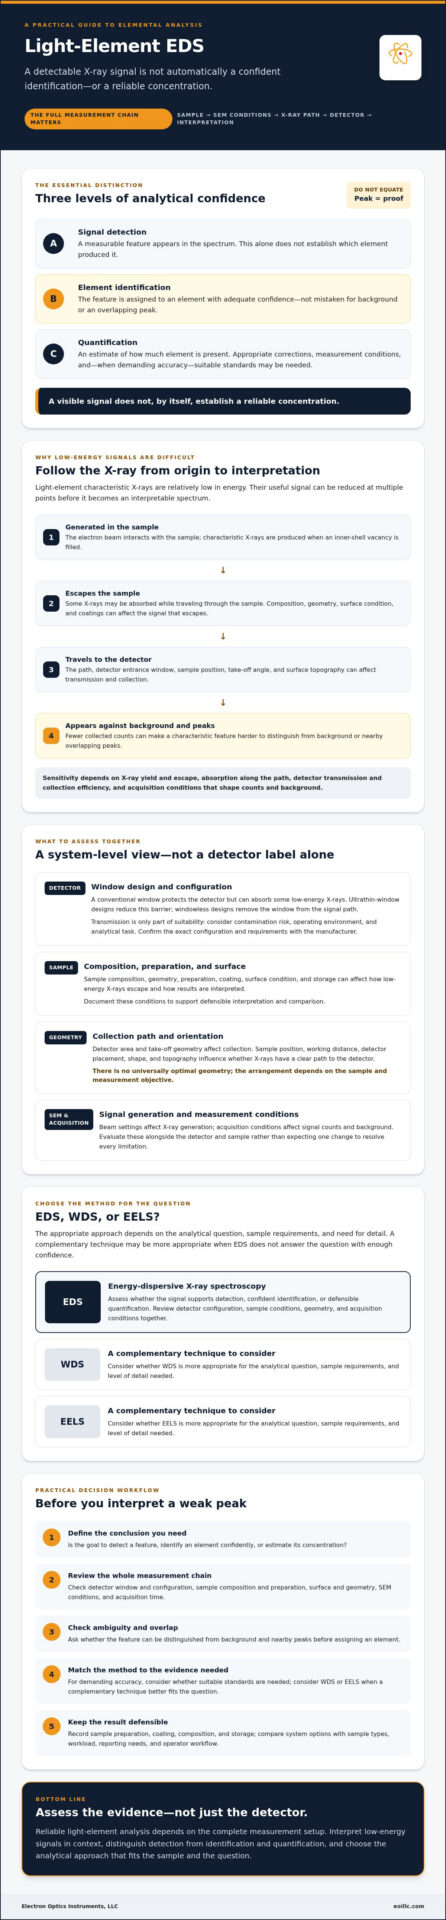
Keep three analytical steps distinct. Signal detection means a measurable feature appears in the spectrum. Element identification means the feature can be assigned to an element with adequate confidence, rather than mistaken for background or an overlapping peak. Quantification estimates the amount of that element and depends on appropriate corrections and measurement conditions. For demanding accuracy, it may also require suitable standards. A visible signal alone does not establish a reliable concentration.
Which elements count as light elements in EDS analysis?
Boron, carbon, nitrogen, and oxygen are common examples. Their characteristic X-rays are relatively low in energy, but no EDS system is guaranteed to detect or quantify each element in every sample. Practical capability depends on detector design and configuration, sample composition and geometry, and acquisition conditions. Treat claims about the lowest detectable element cautiously. Check the supported range and performance for the exact detector and SEM configuration against current manufacturer specifications.
Why are low-energy EDS signals challenging to measure?
Low-energy X-rays can be absorbed before they reach the detector. They may lose intensity while traveling through the sample, passing through a detector entrance window, or crossing other material in their path. Surface coatings and sample geometry can also affect how much of the signal escapes and is collected. The result may be fewer counts, making a characteristic peak harder to distinguish from background or nearby peaks.
Light-element EDS sensitivity depends on X-ray yield and escape from the sample, absorption along the path to the detector, detector transmission and collection efficiency, and acquisition conditions that shape signal counts and background. That is why instrument selection is a system-level decision, not a matter of choosing a detector label alone. Before interpreting a weak peak, ask whether the signal supports a tentative detection, a confident identification, or a defensible quantitative result. This distinction helps keep analytical conclusions within what the measurement can establish.
How Detector Design and SEM Conditions Affect Light Element Detection with EDS
Detector design determines how efficiently emitted X-rays are transmitted and collected, while SEM settings influence how those X-rays are generated. These factors interact, so improving one part of the measurement chain may not resolve a limitation elsewhere. For light element detection with eds, evaluate the detector, sample, geometry, and acquisition conditions together instead of treating any single specification as a guarantee of performance.
How do detector windows and geometry influence sensitivity?
A conventional detector window protects the detector but can absorb some low-energy X-rays before they reach its active area. Ultrathin-window designs reduce this barrier, while windowless designs remove the window from the signal path. Greater transmission can support low-energy analysis, but detector construction alone does not establish suitability. Sample contamination risk, operating environment, and analytical task also matter. Confirm the specific configuration and its requirements with the manufacturer.
Detector area and take-off geometry affect how many X-rays can be collected. A larger active area may capture more X-rays traveling toward the detector, while the take-off angle and sample position determine whether those X-rays have a clear path out of the sample. Surface topography or an unfavourable orientation can obstruct or absorb part of the signal. There is no universally optimal geometry. The best arrangement depends on sample shape, working distance, detector placement, and measurement objective.
Which SEM acquisition conditions should analysts assess?
Accelerating voltage affects electron penetration and the energy available to generate characteristic X-rays. Raising it may increase excitation for some elements, but can broaden the interaction region and reduce spatial specificity. Lower voltage can help confine analysis closer to the surface, yet may not excite every X-ray line effectively. Beam current and acquisition time also influence counts. Higher current or longer collection can improve counting statistics, but may heat, charge, contaminate, or otherwise alter sensitive samples.
Assess these variables together, using the instrument manufacturer’s guidance and the sample’s stability as constraints. Compare spectra collected under controlled conditions, record the settings, and check whether changes improve the relevant peak without causing damage or obscuring other features. More counts can make a signal easier to assess, but they cannot correct peak overlap, sample absorption, contamination, or unsuitable geometry.
Useful light-element signal quality depends on detector transmission and collection geometry as well as beam settings, sample stability, and acquisition time. To compare results across sessions or instruments, document the configuration and conditions instead of relying on the detector label alone. If you are assessing system options, review EDS systems for SEM analysis as part of matching instrument configuration to sample needs and workflow.
EDS, WDS, or EELS: Which Method Fits Light-Element Analysis?
The right method depends on the question, not simply on which instrument offers the most detail. EDS is often a practical starting point for screening composition and mapping elemental distribution. WDS or EELS may be more suitable when peak separation, light-element sensitivity, or chemical-state information is critical. Compare how each method handles your sample and measurement objective.
| Method | Analytical question | Sample requirements | Signal characteristics | Practical constraints |
|---|---|---|---|---|
| EDS | Which elements are present, and where are they distributed? | Can examine a range of samples; preparation and matrix effects influence results. | Collects a broad energy spectrum for rapid elemental screening and mapping, but weak signals and peak overlaps can complicate interpretation. | Fast and versatile, though spectral resolution and sample-specific limits may restrict confident identification or quantification. |
| WDS | Can a difficult or overlapping X-ray signal be separated and quantified more confidently? | Depends on the instrument setup and analytical protocol. | Higher energy resolution than EDS can help distinguish closely spaced peaks. | Measures selected wavelengths sequentially, so analysis is generally slower; verify system capability and standards for the task. |
| EELS | What does the electron energy-loss spectrum reveal about light elements or bonding? | Typically requires a very thin specimen, often under 100 nm. | Can provide information about light elements and bonding or oxidation state. | Requires an appropriate transmission electron microscopy setup and suitable specimen preparation. |
When is EDS a suitable choice for light-element analysis?
Choose EDS when you need to screen for elemental presence, compare regions, or map distribution as part of routine compositional analysis. A weak peak, overlap with another element’s line, or complex matrix should prompt validation rather than an automatic assignment. The advanced SEM techniques guide provides broader context for selecting analytical approaches.
When should analysts consider WDS or EELS instead?
Consider WDS when EDS cannot adequately resolve overlapping peaks or when the required quantification needs greater spectral separation. EELS may suit questions about very light elements or chemical bonding when an appropriately thin specimen and transmission instrument are available. Neither method is universally superior. Verify the element of interest, sample requirements, required confidence, and available system capabilities. For beam-sample interaction context, see the SEM fundamentals guide.
In practice, light element detection with eds can be effective for screening and mapping, but confidence depends on whether the signal, sample, and method fit the question. If results remain ambiguous, a complementary technique or standards-based validation may be needed.
A Practical Workflow for More Reliable Light-Element EDS Results
A disciplined workflow makes light-element EDS findings easier to interpret and reproduce. Start with the analytical question, then assess the sample, set acquisition conditions, and validate the result. Record decisions along the way. This sequence helps distinguish a useful screening result from a quantitative claim that needs stronger evidence.
- Define the question. Decide whether you need to screen for an element, compare its distribution across regions, or report its concentration. Set the required confidence and spatial scale before choosing measurement conditions.
- Document the sample history. Record known composition, preparation steps, coating material, handling, and storage. Note any polishing compounds, mounting media, cleaning residues, or exposure that could introduce surface contamination or alter the measured region.
- Assess the surface and preparation. Choose preparation and coating in light of the sample’s conductivity, stability, topography, and analytical question. A coating, oxide layer, residue, or contamination may contribute signal or attenuate the signal of interest. Do not assume a surface-sensitive measurement represents bulk composition. State which area or layer was analyzed.
- Set and record acquisition conditions. Select beam settings, detector geometry, and collection time according to instrument guidance and sample sensitivity. Check that the conditions can generate the relevant X-ray signal without unacceptable charging, heating, contamination, or beam-induced change. Record settings so measurements can be compared and repeated.
- Review the evidence before reporting. Inspect the full spectrum, background, candidate peak positions, and possible overlaps. Compare relevant sample regions or repeat measurements when needed to assess consistency. If identification remains uncertain, report that limitation rather than presenting a tentative assignment as confirmed.
- Match the conclusion to validation. Treat qualitative screening separately from concentration reporting. For quantitative work, use suitable known standards or an independent analytical method when the required accuracy warrants it. Describe the calibration, assumptions, and uncertainty alongside the result.
Sample-dependent effects matter throughout the sequence. A beam-sensitive material may change during acquisition, while an oxidized or contaminated surface can produce a spectrum that differs from the underlying material. Keep the preparation and acquisition record with the spectrum so later reviewers can assess the result in context.
Reliable light element detection with eds depends on the alignment of sample preparation, instrument conditions, and validation, not on peak assignment alone. To evaluate equipment against your sample and workflow requirements, explore EDS systems for SEM analysis.
Choosing an EDS System for Light-Element Work and Planning Next Steps
Choosing an EDS system for light-element analysis starts with the measurement your laboratory needs to make, not a detector specification in isolation. Consider which elements matter, whether the work involves spot analysis or mapping, how many samples are processed, and whether results are for screening or quantitative reporting. These requirements shape the fit between the SEM, EDS configuration, sample preparation, and operator workflow.
What should a laboratory verify before selecting an EDS configuration?
Ask for current specifications for the exact detector and SEM configuration under consideration. Confirm the supported element range and any relevant conditions or limitations. Do not assume a general product description guarantees performance on your sample. Then assess practical fit against your laboratory’s needs:
- Detector and instrument compatibility: Verify that the proposed EDS configuration is supported by the SEM and its acquisition software.
- Sample geometry and types: Discuss sample dimensions, surface topography, preparation, and any beam sensitivity that could affect collection or measurement.
- Analysis workload: Clarify whether you need occasional point measurements, routine screening, or repeated elemental maps across many samples.
- Reporting requirements: Identify whether qualitative identification is sufficient or whether quantitative results need standards, validation, and documented uncertainty.
- Workflow and support: Ask what operator training, maintenance, and technical support are available for the intended applications, and how they fit your laboratory’s operating needs.
These questions bring trade-offs into view before purchase. A workflow built around routine mapping, for example, may place different demands on acquisition and operator time than one focused on occasional analysis of beam-sensitive samples. Confirm the configuration and operating requirements with the manufacturer or equipment provider instead of relying on a generic detection claim.
How can technical support help match EDS to the application?
A useful system discussion starts with the materials you analyze and the decisions your results must support. Share sample types, preparation methods, workload, and reporting expectations to help assess whether an available EDS system and SEM arrangement align with the work. This also helps identify questions that need manufacturer confirmation, including detector specifications and supported elements.
Electron Optics Instruments, LLC distributes SEM equipment and EDS systems, and provides microscope service, maintenance, repairs, and on-site training. These services are relevant when planning how a system will fit into laboratory operations. They do not replace configuration-specific verification or guarantee a particular analytical outcome. For light element detection with eds, assess fit across the full measurement workflow, from sample setup through interpretation.
To discuss your sample types, analytical goals, and EDS system requirements, Discuss your EDS application with Electron Optics Instruments, LLC.
Plan Your Next Light-Element Analysis with Confidence
Reliable light element detection with eds depends on more than whether a peak appears in a spectrum. Detector configuration, sample condition, SEM settings, and the analytical question all shape what the data can support. Treat screening, identification, and quantification as distinct outcomes, document measurement conditions, and validate results when the required confidence demands it. If EDS cannot resolve the question, consider whether WDS or EELS better fits the sample and analytical need.
Selecting a system is also a workflow decision. Confirm detector specifications for the exact configuration, then consider sample types, reporting requirements, operator training, and ongoing support. Electron Optics Instruments, LLC brings more than 30 years of electron microscopy industry experience and offers EDS systems, microscope service and repairs, and on-site technical training. These resources can inform equipment planning, but do not replace application-specific verification.
Ready to assess your samples and analytical goals against EDS system requirements? Discuss your EDS application with Electron Optics Instruments, LLC. A well-matched approach can help your laboratory move forward with clearer, more defensible results.
Frequently Asked Questions
Can EDS detect light elements such as boron, carbon, nitrogen, and oxygen?
Yes, EDS can detect these elements if the detector configuration and measurement conditions support their low-energy X-rays. Detection is not assured for every sample. Composition, surface condition, coatings, signal strength, and peak overlaps can affect whether a signal is identifiable. Check the manufacturer’s specifications for the exact detector and SEM configuration, then evaluate the result in the context of the sample and analytical question.
Why are light elements more difficult to detect with EDS?
Light elements produce low-energy X-rays that can be absorbed within the sample, by a detector entrance window, or by material along the path to the detector. This reduces the signal reaching the detector. When counts are low, peaks may be hard to distinguish from background or overlapping signals. Sample preparation, geometry, detector design, beam conditions, and acquisition time all influence confidence in identification and quantification.
How does a windowless EDS detector affect light-element detection?
A windowless detector removes the entrance-window barrier, reducing absorption of low-energy X-rays at that point in the signal path. This can improve transmission for light-element analysis, but it does not eliminate absorption in the sample or other measurement limitations. Windowless designs are not automatically suitable for every application. Confirm supported elements, operating requirements, and performance for the exact detector configuration with its manufacturer.
What is the lowest atomic number EDS can detect reliably?
There is no single lowest atomic number that applies reliably to every EDS system and sample. Some windowless EDS configurations are designed to detect lithium, but that capability should not be assumed for all detectors or measurement conditions. Verify the element range for the specific configuration and assess whether the sample produces a usable signal. “Detectable” also differs from confidently identifying or accurately quantifying an element.
Can EDS quantify light elements accurately?
EDS can quantify light elements, but accuracy depends on signal quality, peak separation, sample condition, calibration, and analysis method. Standardless results are convenient but generally less accurate than measurements calibrated with suitable standards. Typical relative-error ranges are approximately 5-10% for standardless analysis and 1-2% for standards-based work under appropriate conditions; these are not guarantees. Report the method, limitations, and uncertainty.
When should I use WDS instead of EDS for light-element analysis?
Consider WDS when EDS peak overlaps make identification or quantification uncertain, or when the analysis requires stronger spectral separation. Typical energy resolution is about 5-10 eV for WDS, compared with approximately 125-130 eV for modern EDS detectors. WDS measures wavelengths sequentially, so analysis can take longer. Confirm instrument capability and suitability for the element, sample, and required confidence.
Does sample coating affect light-element EDS results?
Yes. A coating can contribute its own characteristic X-rays or affect the low-energy signal traveling from the sample to the detector. For example, a carbon coating can complicate interpretation when carbon is the element of interest. The impact depends on coating material, thickness, sample topography, and analytical goal. Record coating and preparation details, and select an approach compatible with the sample and measurement.