The most sophisticated Silicon Drift Detector remains an incomplete tool without a rigorous mastery of matrix correction algorithms. While qualitative peak identification provides a necessary baseline, the systematic implementation of quantitative eds analysis techniques is what elevates a standard observation into a definitive microanalytical characterization. Many researchers encounter significant variance between sample sets or harbor legitimate skepticism toward the reliability of standardless software results. These challenges frequently arise from a failure to meticulously manage the geometric and physical variables that influence X-ray emission and subsequent absorption within the specimen.
We understand that achieving data of sufficient quality for industrial certification or peer-reviewed publication requires precision that transcends simple automated routines. This professional guide enables you to master the technical parameters required to convert qualitative X-ray data into exact, reproducible elemental concentrations. You’ll gain a comprehensive understanding of the physics governing ZAF and Phi-Rho-Z corrections, alongside practical strategies to optimize hardware settings for maximum EDS precision. We conclude by outlining a repeatable standard operating procedure designed to ensure consistency across the Veritas Series and Cube II platforms in the 2026 analytical environment.
Key Takeaways
- Distinguish between qualitative peak identification and the rigorous calculation of atomic weight fractions required for definitive elemental characterization.
- Evaluate the specific criteria for selecting between standardless sensitivity factors and standards-based analysis when investigating complex matrices or light elements.
- Gain insight into the mechanics of ZAF and Phi-Rho-Z algorithms to accurately account for the physical interactions of backscattering, absorption, and fluorescence.
- Refine your quantitative eds analysis techniques by optimizing critical acquisition parameters, including sample surface planarity and the geometric precision of the Take-Off Angle.
- Integrate high-resolution imaging with precise X-ray mapping through the advanced architectural stability provided by the Veritas Series and Cube II Benchtop SEM platforms.
The Evolution of Energy Dispersive Spectroscopy: From Qualitative to Quantitative EDS Analysis
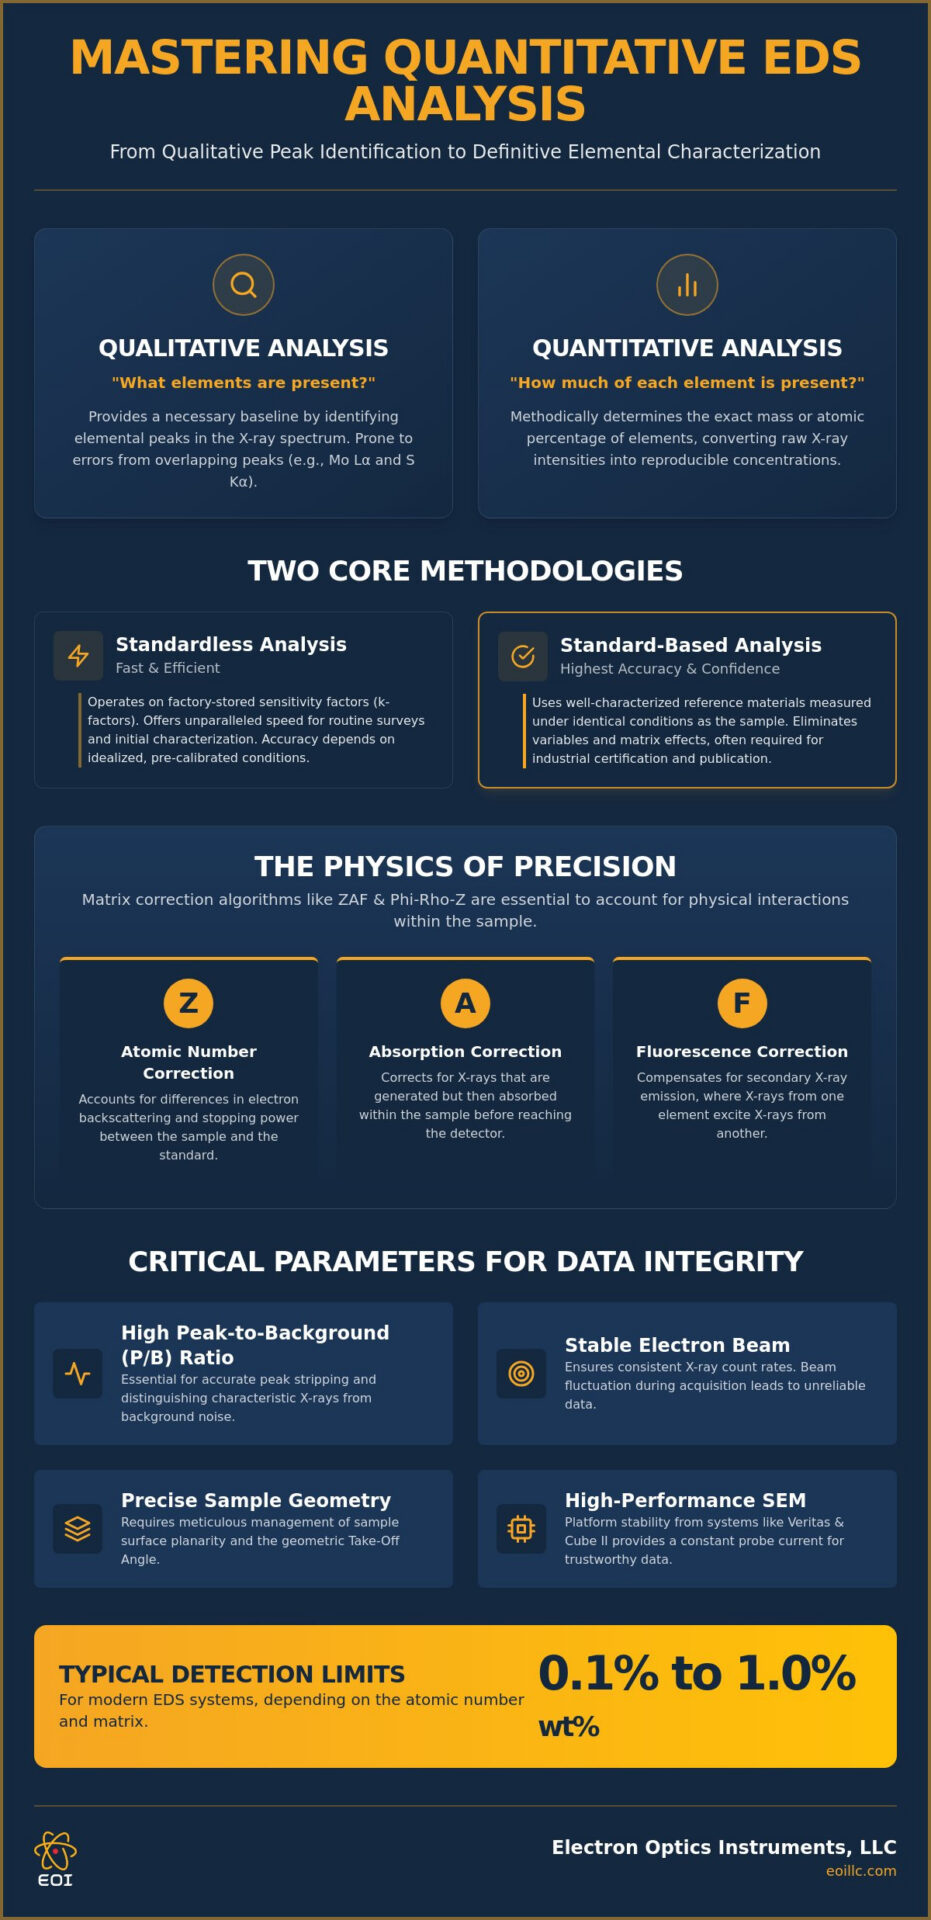
While early iterations of Energy Dispersive Spectroscopy were often relegated to semi-quantitative survey work, the contemporary landscape of 2026 requires a more disciplined approach. The transition from simple elemental identification to the rigorous application of quantitative eds analysis techniques represents a fundamental shift in microanalytical capability. Quantitative EDS is defined as the methodical determination of the mass or atomic percentage of specific elements within a localized volume of a sample. This process moves beyond qualitative “peak hunting” by employing mathematical models to calculate exact weight fractions from raw X-ray intensities.
Modern analytical software relies heavily on the Peak-to-Background (P/B) ratio to distinguish characteristic X-rays from the underlying Bremsstrahlung continuum. A high P/B ratio is essential for accurate peak stripping and deconvolution, especially when you’re analyzing trace elements or complex alloys. In current industrial sectors, failure analysis and regulatory compliance demand a level of precision that qualitative methods cannot satisfy. Auditors and researchers now require documented proof of elemental concentration to validate material integrity and performance specifications. Establishing a repeatable SOP for quantitative eds analysis techniques begins with understanding this hardware-software synergy.
The Distinction Between Identification and Quantification
Identifying an element’s presence via Energy-dispersive X-ray spectroscopy is merely the initial phase of characterization. The real complexity arises when overlapping peaks, such as the Mo L-alpha and S K-alpha lines, threaten to skew results. Without rigorous quantification, these overlaps can lead to significant errors in weight fraction reporting. Detection limits for modern EDS systems typically range from 0.1 to 1 weight percent depending on the atomic number and the specific matrix being analyzed.
The Role of the Scanning Electron Microscope in Data Integrity
The integrity of any quantitative result is inextricably linked to the performance of the Scanning Electron Microscope. Beam stability and precise current regulation are the primary drivers of X-ray count rate consistency. If the electron beam fluctuates during acquisition, the resulting data lacks the necessary reliability for publication-quality reports. High-brightness sources found in the Veritas series and the Cube II Benchtop SEM provide the necessary platform stability to maintain a constant probe current. This hardware reliability establishes the baseline for trustworthy data in any rigorous laboratory environment, ensuring that the measured X-ray flux is a true reflection of the sample’s chemistry rather than an artifact of instrument drift.
Standardless vs. Standard-Based Quantitative Techniques
Standardless analysis operates on the premise of factory-stored sensitivity factors, often referred to as k-factors. These parameters are pre-calibrated by the manufacturer to account for detector efficiency and X-ray yield across the periodic table under idealized conditions. While this approach offers unparalleled speed for routine surveys, the pursuit of absolute accuracy in quantitative eds analysis techniques often necessitates a transition to standard-based protocols. The choice between these two methodologies is not merely a matter of convenience; it’s a strategic decision based on the required level of analytical confidence and the complexity of the specimen matrix.
Standard-based analysis involves “Standardization,” which is the methodical process of measuring well-characterized reference materials under instrumental conditions identical to those of the unknown sample. This eliminates variables related to detector drift, electronic noise, and specific matrix effects that factory calibrations might not fully encompass. For laboratories requiring ISO-certified results or those working with light elements ranging from Beryllium to Fluorine, standard-based methods remain the gold standard for microanalytical precision. This technique ensures that every measured X-ray count is anchored to a known physical reality rather than a mathematical approximation.
When to Rely on Standardless Analysis
Standardless routines are ideal for rapid screening and high-throughput industrial quality control where the primary goal is identifying major constituents or heavy elements. The 2026 generation of EDS software utilizes “Virtual Standards” that have significantly narrowed the accuracy gap for transition metals and heavier elements. However, these algorithms often struggle with non-conductive or highly porous samples, as local charging and irregular geometry can disrupt the predictable X-ray flux. For users seeking to maximize their throughput without sacrificing fundamental reliability, exploring the integrated software capabilities on the Veritas Series provides a balanced starting point for routine characterization.
Implementing Standard-Based Protocols
Execution of a standard-based protocol requires a meticulous checklist to ensure data integrity and publication-quality results. Unlike standardless methods, this approach demands a higher degree of operator intervention and a more robust understanding of the underlying physics. Consider the following requirements for a successful implementation:
- Reference Selection: You should choose pure elements for simple matrices or stoichiometric compounds, such as SiO2 or GaP, for complex minerals and semiconductors.
- Parameter Parity: It’s essential that the accelerating voltage, beam current, and working distance are identical between the standard and the unknown to maintain a constant excitation volume.
- Recalibration Frequency: Establish a monthly or quarterly recalibration schedule to account for filament aging and potential detector window contamination.
Applying these rigorous quantitative eds analysis techniques ensures that your elemental concentrations are not just estimates, but verified measurements suitable for the most demanding industrial certifications. While the time investment is higher, the reduction in measurement uncertainty provides a definitive advantage in failure analysis and advanced materials development.
Matrix Correction Models: Understanding ZAF and Phi-Rho-Z Algorithms
The conversion of raw X-ray intensities into precise elemental concentrations requires sophisticated mathematical models to account for the complex physical interactions within the specimen. These interactions, collectively known as matrix effects, can significantly alter the measured signal compared to the actual chemical composition. Implementing advanced quantitative eds analysis techniques relies on the selection of a correction algorithm that best matches the sample geometry and the energy of the characteristic X-rays being measured. While several models exist, the ZAF and Phi-Rho-Z (φρZ) methods remain the pillars of microanalytical accuracy in 2026.
The traditional ZAF correction is a tripartite model that addresses the Atomic Number effect (Z), Absorption (A), and Fluorescence (F). The Z-factor accounts for variations in backscattering and electron retardation. Specifically, it incorporates the backscatter coefficient, which represents the fraction of incident electrons that escape the sample surface before their energy is fully dissipated within the interaction volume. Simultaneously, the retardation factor adjusts for the rate at which electrons lose energy as they penetrate deeper into the matrix, a process directly influenced by the mean atomic number of the material.
Absorption represents the most significant correction factor, particularly when you’re analyzing low-energy X-rays or light elements. As X-rays travel from their point of generation to the detector, a portion of the signal is re-absorbed by the sample itself. This attenuation is a function of the mass absorption coefficient and the absorption path length. In modern quantitative eds analysis techniques, the software must precisely calculate this path based on the detector’s take-off angle and the specimen’s orientation.
The Physics of the ZAF Correction
The mean atomic number of the matrix dictates the density and depth of the interaction volume, which in turn determines where X-ray generation occurs. A higher Z-matrix typically results in a shallower generation depth but increased backscattering, necessitating a robust Z-correction to avoid underestimating concentrations. Fluorescence occurs when primary X-rays excite secondary X-rays from other elements in the matrix. This effect is most pronounced when the energy of a primary X-ray line sits just above the absorption edge of another element present in the sample, leading to an artificially inflated count rate for the secondary element.
Phi-Rho-Z: The Advanced Alternative
Phi-Rho-Z is the modern successor to the ZAF model, offering superior performance for analyzing non-flat surfaces, tilted samples, and layered structures. Unlike ZAF, which treats each correction factor as a separate entity, Phi-Rho-Z utilizes a depth-distribution function to model X-ray production throughout the interaction volume. This mathematical modeling of the X-ray production depth distribution allows for more accurate corrections when the sample geometry deviates from the ideal polished flat. When you’re operating within your EDS software interface, selecting the Phi-Rho-Z algorithm is often preferable for complex metallurgy or thin-film analysis where the standard ZAF assumptions regarding depth and absorption may not hold. This methodological flexibility is a hallmark of high-end systems like the Veritas Series, where hardware precision meets algorithmic sophistication.
Critical Parameters for Reliable Quantitative EDS Data Acquisition
The transition from theoretical correction models to empirical results requires a meticulous command of the acquisition environment. Even the most advanced quantitative eds analysis techniques will fail if the physical parameters of the SEM chamber aren’t strictly controlled. Data integrity begins with sample preparation. An absolute necessity for quantitative work is a flat, polished surface. Topographical variations introduce shadowing effects where X-rays generated in a valley are absorbed by a neighboring peak before reaching the detector. This inconsistent absorption path invalidates the assumptions made by ZAF and Phi-Rho-Z algorithms, leading to significant errors in weight fraction calculations.
Optimizing the Take-Off Angle (TOA) is equally vital for maximum X-ray collection efficiency. The TOA is the angle between the sample surface and the center of the EDS detector. A higher TOA typically reduces the absorption path length within the sample, which is critical for the accurate detection of light elements. The electron beam’s accelerating voltage (kV) determines the size and depth of the interaction volume. For precise quantification, researchers generally employ an overvoltage ratio of 1.5 to 3 times the critical excitation energy of the elements of interest. This ensures sufficient X-ray yield without creating an unnecessarily large interaction volume that might encompass subsurface phases or layers.
Geometric Discipline in the SEM Chamber
Maintaining a constant working distance (WD) is the foundation of geometric discipline. In systems like the Cube II Benchtop SEM, the relationship between the electron column and the EDS detector is precisely calibrated. Any deviation in WD alters the solid angle of collection and the effective TOA. Sample tilt must be accounted for with extreme precision. While Phi-Rho-Z models can accommodate some tilt, the most reliable results are obtained when the specimen is perpendicular to the beam, ensuring a symmetrical interaction volume. This alignment is critical for maintaining the accuracy of the absorption correction factors discussed in previous sections.
Optimizing Count Rates and Acquisition Time
Reliable data acquisition requires a balance between statistical precision and sample preservation. High beam currents increase the X-ray count rate but can lead to excessive dead time and pulse pile-up, where the detector cannot process individual photons fast enough. This results in spectral artifacts and lost data. A common industry standard is the “10,000 counts per peak” rule, which suggests that acquiring at least 10,000 net counts for a specific characteristic line minimizes the statistical error to approximately 1%. For beam-sensitive materials like polymers, you must lower the current and extend acquisition times, provided the system exhibits the architectural stability to prevent beam drift. If you’re looking to upgrade your laboratory’s microanalytical throughput, consider exploring our range of EDS Systems for integrated hardware-software excellence.
Integrated EDS Solutions with Cube II and Veritas Series SEMs
The successful application of quantitative eds analysis techniques ultimately rests on the architectural integrity of the hardware platform. While theoretical models provide the mathematical framework, the physical stability of the electron column and the detector interface determines the absolute limit of precision. Modern microanalysis in 2026 demands a seamless synergy between high-resolution imaging and X-ray collection. The Veritas Series SEM exemplifies this integration, providing a large-chamber environment where complex samples can be characterized with uncompromising detail. These systems are designed to minimize electronic noise and mechanical vibration, ensuring that the measured X-ray flux remains a true reflection of the specimen’s chemistry rather than an instrumental artifact.
Benchtop SEM: Quantitative Power in a Compact Footprint
A common misconception in the industry suggests that benchtop systems are limited to qualitative surveys or semi-quantitative estimates. The Cube II Benchtop SEM dispels this myth by providing the platform stability required for rigorous quantitative work. It’s equipped with advanced Silicon Drift Detector (SDD) technology, which allows for high-count-rate precision without the resolution degradation seen in older systems. Automation features within the Cube II software simplify the implementation of standard-based workflows, making it easier for laboratories to transition from peak hunting to definitive weight fraction calculations. This compact powerhouse brings professional-grade quantitative eds analysis techniques to facilities where floor space is at a premium, without sacrificing the reliability of the analytical output.
Expert Support and Training for Analytical Success
Mastering the intricacies of ZAF corrections and geometric optimization requires more than just high-end hardware; it necessitates a deep understanding of the software-specimen interaction. Leveraging Electron Optics Instruments training allows your team to achieve quantitative proficiency quickly. Our on-site programs focus on the practical application of advanced EDS software, ensuring that operators can confidently navigate the choice between ZAF and Phi-Rho-Z algorithms. Training is not a one-time event but an ongoing process of refinement that directly impacts the quality of your publication-ready data.
Reliability in a high-stakes research environment also depends on the consistent performance of the hardware. Annual service contracts and preventative maintenance visits are essential for maintaining detector calibration and energy resolution. Over time, factors like filament aging or detector window contamination can introduce subtle drifts in the X-ray signal. Regular maintenance ensures that your system remains anchored to its calibrated baseline, providing the stability required for ISO-certified results. We offer customized service agreements designed to support the specific throughput and accuracy requirements of your laboratory, ensuring that your investment in microanalytical technology continues to yield precise, actionable insights for years to come.
Advancing Analytical Precision in the Modern Laboratory
Achieving publication-quality results requires a departure from automated assumptions in favor of methodical geometric and algorithmic discipline. By mastering quantitative eds analysis techniques, researchers can effectively mitigate matrix effects and ensure that elemental weight fractions reflect the physical reality of the specimen. Whether you’re utilizing the compact stability of the Cube II or the high-resolution capabilities of the Veritas Series, the intersection of hardware reliability and operator proficiency remains the cornerstone of modern microanalysis. Success in 2026 isn’t defined by the speed of acquisition alone, but by the verifiable accuracy of the data produced.
Electron Optics Instruments brings over 30 years of industry expertise in electron optics to every partnership. As the sole US distributor for EmCraft Scanning Electron Microscopes, we provide more than just advanced hardware. We offer comprehensive on-site technical training and customized service contracts to maintain your system’s peak performance. Explore our EDS-integrated SEM solutions and request a technical consultation to elevate your laboratory’s analytical standards today. We’re ready to help you push the boundaries of what’s possible in elemental microanalysis.
Frequently Asked Questions
Is standardless EDS analysis accurate enough for publication?
Standardless analysis is acceptable for many peer-reviewed journals, provided the matrix is relatively simple and the detector is well-characterized by the manufacturer. However, for complex alloys or light elements, researchers often employ standards-based quantitative eds analysis techniques to achieve the sub-one-percent accuracy required for high-impact publication. The choice ultimately depends on the journal’s rigor and the specific analytical uncertainty acceptable for your study.
What is the difference between ZAF and Phi-Rho-Z corrections?
ZAF corrections treat the physical interactions of the atomic number (Z), absorption (A), and fluorescence (F) as separate mathematical factors. In contrast, Phi-Rho-Z models utilize a depth-distribution function to describe X-ray production as a function of mass depth. This integrated approach offers superior precision when you’re analyzing tilted specimens or multi-layered structures where the traditional ZAF assumptions regarding interaction volume symmetry don’t apply.
How does accelerating voltage (kV) affect quantitative EDS results?
Accelerating voltage dictates the depth and lateral spread of the interaction volume within the specimen. To ensure reliable quantification, you must maintain an overvoltage ratio between 1.5 and 3 times the critical excitation energy of the elements of interest. If the voltage is too low, X-ray yield is insufficient; if it’s too high, the interaction volume may exceed the region of interest or increase absorption errors for low-energy lines.
Can I perform quantitative EDS on a non-conductive sample?
Quantitative analysis on non-conductive specimens is possible but requires meticulous preparation to prevent surface charging. Charging deflects the incident beam and alters the landing energy, which invalidates the correction algorithms. Applying a thin, conductive carbon coating or utilizing the low-vacuum capabilities of the Veritas series allows for stable acquisition while maintaining the geometric integrity required for accurate weight fraction calculations.
What is the minimum detection limit for a modern EDS system in 2026?
Modern EDS systems in 2026 generally achieve a minimum detection limit ranging from 0.1 to 1.0 weight percent. This limit is heavily influenced by the atomic number of the element, the specific matrix composition, and the total acquisition time. While Silicon Drift Detectors have significantly improved sensitivity, the statistical background noise inherent in X-ray production remains the primary constraint on trace element quantification.
Why is sample polishing critical for quantitative microanalysis?
Polishing is essential because it creates a planarity that ensures a constant X-ray take-off angle across the entire analysis area. Topographical variations on unpolished surfaces cause shadowing, where the sample itself absorbs X-rays before they reach the detector. This inconsistent attenuation leads to substantial errors in the A-factor of the ZAF correction, rendering the final elemental concentrations unreliable for professional characterization.
How often should I calibrate my EDS detector using standards?
You should calibrate your EDS detector using known standards at least monthly or whenever there’s a significant change in the instrumental environment. Regular calibration accounts for detector drift and filament aging, ensuring that the stored sensitivity factors remain accurate. Laboratories operating under ISO-certified protocols often perform a quick standardization check at the start of each analytical session to guarantee the highest level of data integrity.
Can benchtop SEMs like the Cube II perform quantitative EDS analysis?
Benchtop systems like the Cube II are fully capable of performing professional-grade quantitative eds analysis techniques when paired with a high-performance Silicon Drift Detector. These compact platforms provide the necessary beam stability and vacuum control to execute both standardless and standards-based routines. Their integrated software architecture simplifies the application of complex matrix corrections, making them an efficient solution for high-throughput industrial microanalysis.