
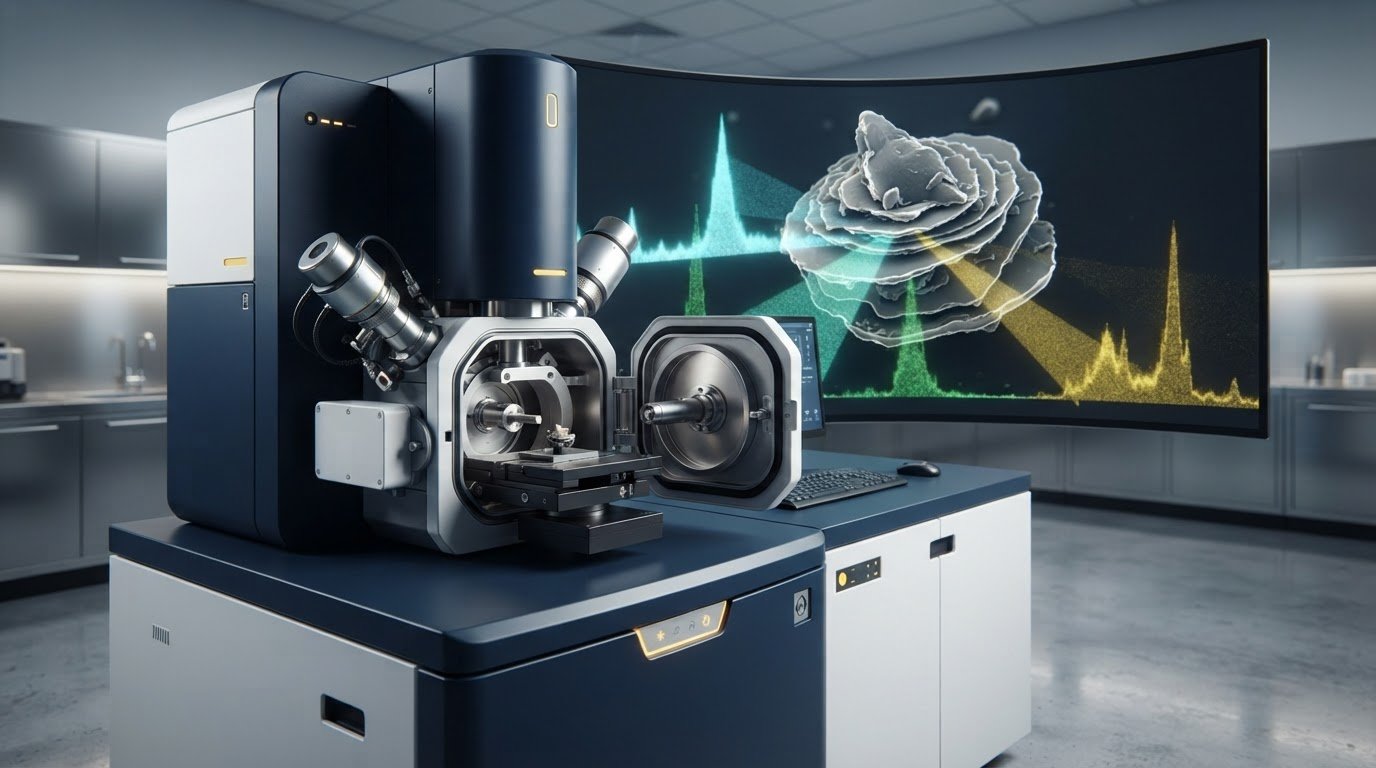
What if a particle’s elemental fingerprint indicates what it contains, but not where it came from? That distinction matters when an unknown contaminant could affect product performance, cleanliness, or process yield. Analyzing contaminants with sem-eds can reveal a particle’s morphology and elemental composition, but mixed particles, attached substrates, and sample-preparation effects can complicate interpretation.
Reliable conclusions depend on more than a spectrum. You need a repeatable workflow that preserves particle context, records analytical conditions, and separates direct observations from hypotheses about origin. This guide takes you from representative sample collection and SEM imaging through EDS acquisition and interpretation, then shows how to use the evidence to prioritize process investigations and control measures. Consistent documentation also helps teams compare results across samples and investigations.
At each stage, practical choices matter, including how to handle ambiguous or mixed signals and how to avoid treating composition as proof of source. The goal is a disciplined framework for turning SEM-EDS findings into defensible next steps while keeping uncertainty visible.
Key Takeaways
- Set a clear investigation objective before analysis so sampling and imaging decisions answer the question at hand.
- Use a consistent workflow that documents sample identity, collection context, and handling alongside analytical results.
- When analyzing contaminants with sem-eds, distinguish particle morphology and elemental findings from interpretations about composition or origin.
- Choose manual review or automation according to particle volume, sample variability, and the consequences of overlooking a contaminant.
- Rank possible sources by comparing particle evidence with process steps, materials, equipment, and relevant reference samples.
Why Analyze Contaminants with SEM-EDS?
A contamination investigation is more useful when its goal is clear before the sample reaches the instrument. Are you trying to detect unexpected particles, characterize their visible and elemental features, compare particles from different locations, or decide which findings merit further investigation? These objectives are related but distinct. A filter may reveal particles captured from a fluid or gas stream, while particles on a manufactured part may raise questions about surface cleanliness, wear, or material handling. The analytical question determines what evidence to collect and how to compare it.
SEM-EDS combines scanning electron microscope imaging of a contaminant particle with energy-dispersive X-ray analysis of the elements detected in the analyzed interaction volume. Together, these outputs help characterize a particle, but they do not independently establish its unique compound, process origin, or role in a failure. An elemental match can support a source hypothesis; confirming that hypothesis requires comparison with other evidence.
Which contamination questions can SEM-EDS help answer?
Analyzing contaminants with sem-eds can help teams examine unexpected particles on manufactured parts, filters, or material surfaces. Imaging shows shape, approximate size, and position, while elemental results provide compositional clues. Context makes comparisons more useful: a particle embedded in a surface may present a different investigative question from one resting loose on a filter.
- Are particles from different locations similar in morphology and elemental composition?
- Does a particle appear distinct from the surrounding surface or substrate?
- Which findings should be compared with process materials or reference samples?
These observations can narrow the investigation, but they do not automatically prove a particular source. Similar elemental signals may be consistent with several materials or process stages.
What SEM images and EDS spectra each contribute
SEM images provide visual evidence of particle distribution, morphology, and surface location. They can show whether a feature is isolated or clustered, angular or rounded, and attached to or separate from the material beneath it. EDS spectra provide evidence about elements detected within the analyzed interaction volume, which may include contributions from both a particle and its substrate. For an overview of Energy-dispersive X-ray spectroscopy (EDS), see the technique’s underlying analytical principles.
Interpret images and spectra together, while keeping their limits visible. If a small particle sits on a metal surface, for example, the spectrum may include elements from both. Record the analysis location and review the image alongside the spectrum so substrate signals are not treated as particle composition without qualification. EDS identifies elements; it does not, by itself, identify a unique chemical compound, manufacturing step, supplier, or failure mechanism.
This distinction gives the investigation a disciplined starting point: document what you observed, describe what the elemental evidence supports, and label explanations about origin as hypotheses to test. Readers seeking instrument fundamentals can review the fundamental principles of scanning electron microscopy.
How to Analyze Contaminants with SEM-EDS: A Step-by-Step Workflow
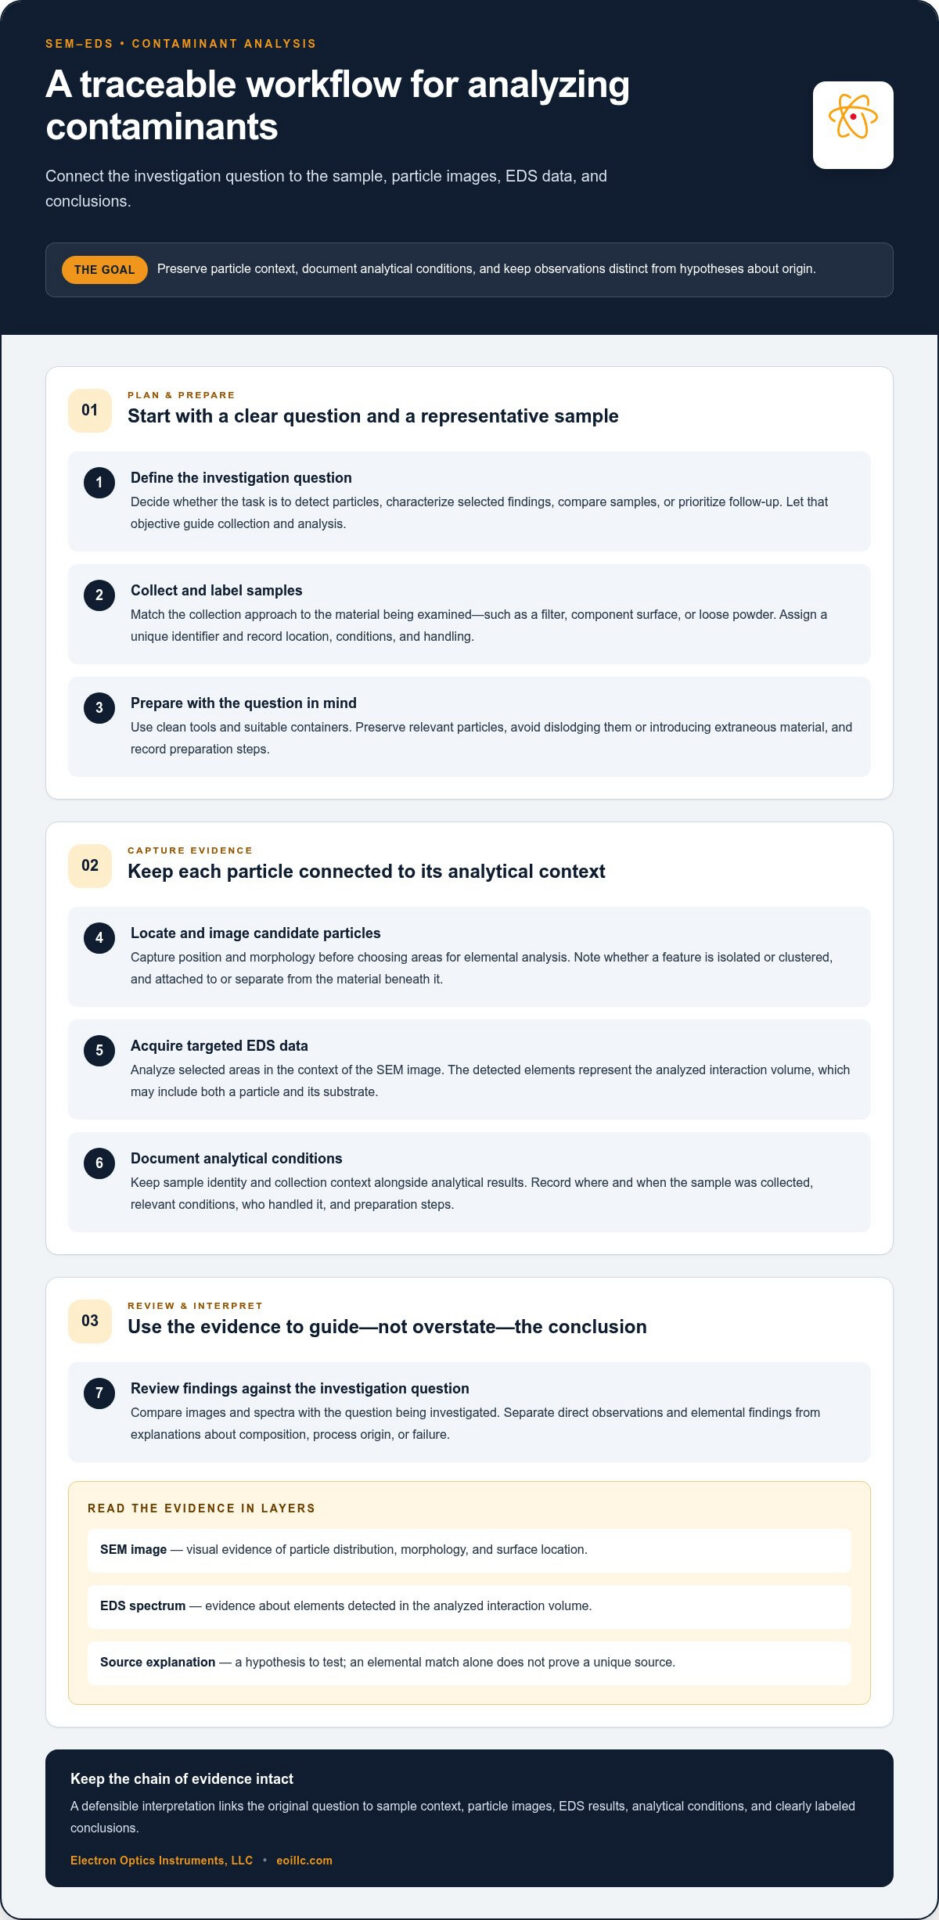
A defensible workflow connects the original investigation question to every sample, image, spectrum, and conclusion. A practical sequence is to define the question, collect and prepare a representative sample, locate and image particles, acquire targeted EDS data, document conditions, and review the evidence against the question.
Plan collection and prepare a representative sample
Collection and preparation determine what evidence remains available for analysis. Match the collection method to the suspected contaminant and the material being examined: a filter, a component surface, and a loose powder each require different handling considerations. Use clean tools and containers suited to the sample and objective. Avoid steps that could dislodge relevant particles or introduce extraneous material.
Preserve sample identity and context throughout handling. Record where and when the sample was collected, conditions relevant to the investigation, who handled it, and any preparation steps. Do not assume one mounting or preparation method suits every particle type or substrate. The objective is to retain features needed for analysis while minimizing changes that could affect what the instrument observes.
- Define the investigation question. Specify whether the task is to detect particles, characterize selected findings, compare samples, or prioritize follow-up. This decision guides collection and analysis.
- Collect and label samples. Use a collection approach suited to the surface or medium, assign a unique identifier, and document location, conditions, and handling.
- Prepare with the question in mind. Choose handling and preparation steps that preserve relevant particles and limit introduced contamination. Record what you did.
- Locate and image candidate particles. Capture each particle’s position and morphology before selecting areas for elemental analysis. This preserves context for interpreting signals.
- Acquire EDS data strategically. Choose points or maps that address the question, such as comparing a particle with nearby substrate or examining variation across a particle.
- Document and review results. Record acquisition conditions and link each spectrum to its image, sample identity, and analysis location. Check whether the evidence answers the original question and note limitations.
Image particles, acquire EDS data, and document conditions
Begin with imaging to locate relevant features and record their position and appearance. Then select analysis points or maps based on the investigation question, rather than collecting signals without a comparison plan. For example, analyzing a particle and adjacent material separately may help assess whether the substrate contributes to the measured signal.
Record the conditions needed to interpret or reproduce the analysis, including relevant instrument and detector settings, analysis location, and preparation details. These records help distinguish differences in particle evidence from differences in how samples were examined. Broader operating practices are covered in this SEM operation guide.
Consistent SEM and EDS operation, supported by appropriate equipment and operator training, can strengthen repeatability across investigations. Laboratories developing their workflow can explore SEM and EDS equipment and operator training as part of building that capability. Electron Optics Instruments, LLC offers EDS systems and on-site training for SEM and tabletop SEM operation, including basic maintenance and cleaning procedures.
How to Interpret SEM-EDS Results Without Overstating the Evidence
A sound interpretation keeps four layers distinct: what the image shows, which elements the EDS analysis detects, what those observations may indicate, and which source explanations remain hypotheses. This separation makes a report useful without turning a plausible explanation into a stated fact. It also gives reviewers a clear path from measurement to conclusion.
For each particle or analysis region, record the evidence in these categories:
- Direct observation: Describe visible morphology, location, and relationship to the surrounding surface.
- Elemental finding: State which elements were detected under the recorded analytical conditions, noting relevant signal limitations.
- Interpretation: Explain what the combined image and spectrum are consistent with, while identifying uncertainty.
- Source hypothesis: Identify candidate materials or process steps that merit comparison, rather than presenting them as proven causes.
EDS identifies elements, not necessarily a unique compound, manufacturing step, supplier, or failure cause. The signal comes from an interaction volume, so the result may include contributions from the particle and underlying substrate. Particle size, shape, orientation, and analysis conditions can also influence the spectrum. Elemental similarity alone does not prove that two particles share a source.
Read spectra and maps in particle context
Interpret spectra alongside images and, where available, elemental maps. Check whether the analysis area covers only the particle or also includes nearby material; a small or thin particle on a substrate can yield mixed signals. Compare different regions if the particle appears heterogeneous. Overlapping signals or mixtures can complicate simple labels, so report detected elements rather than assigning an exact compound from elemental composition alone.
Report uncertainty and test source hypotheses
Use confidence-qualified language, such as “consistent with” or “may indicate,” and state which observations support each interpretation. Compare a candidate source with relevant reference samples and process context before ranking it. If the investigation requires chemical or structural specificity beyond elemental evidence, identify that limitation and consider complementary analysis methods suited to the question.
Acquisition conditions matter because results depend on how the analysis was performed. Preserve the settings and analysis location associated with each spectrum, and do not treat differences between results as material differences until measurement conditions and sample context have been considered. A conclusion should describe both what the evidence supports and what it cannot resolve.
For example, if two particles show similar elemental signals but differ in morphology or surface position, report those differences rather than assigning them a shared source. A defensible conclusion might rank a candidate material as plausible, explain the matching evidence, and identify what comparison or follow-up would strengthen or weaken that hypothesis. This disciplined approach to analyzing contaminants with sem-eds helps teams act on findings while keeping uncertainty explicit.
Manual or Automated SEM-EDS: Choose an Approach for the Investigation
Manual and automated SEM-EDS are different ways to organize an investigation, not competing guarantees of accuracy. The right approach depends on the number of particles, how much they vary, the question being asked, and the consequences of overlooking a relevant finding. A targeted examination may call for expert selection and interpretation. Recurring samples with larger particle populations may benefit from standardized screening and reporting.
Compare the approaches against the practical demands of the work:
- Throughput: Consider the volume of particles and samples, along with how often the investigation is repeated.
- Repeatability: Determine whether consistent classification rules and comparable records across runs are essential.
- Flexibility: Assess whether particles and sample contexts are predictable enough for defined rules or require case-by-case judgment.
- Reporting: Establish whether the output must support exploratory review, routine comparison, or a structured quality record.
- Risk of missed findings: Consider the impact of overlooking unusual or low-frequency particles, and plan a review strategy accordingly.
Automation can standardize a defined workflow, but it still depends on suitable setup, appropriate classification criteria, and review of results. Neither method is universally superior. A hybrid approach may also fit, with automated screening followed by expert review of atypical or consequential findings.
When manual particle analysis is a suitable fit
Manual analysis often suits a focused investigation involving a limited number of particles or an exploratory question whose answer is not yet clear. Expert review is valuable when particle appearance, location, or substrate context varies substantially and fixed classification rules may miss meaningful differences. Document how particles were selected and why, so the report makes the review scope transparent and supports interpretation.
When automated analysis may support repeatable screening
Automation may be useful for larger or recurring particle populations, particularly when the investigation benefits from consistent classification rules across samples. Before adopting it, assess whether the rules reflect the types of particles present and whether the resulting reports answer the quality question. Review atypical results and retain a path for expert judgment. Related advanced SEM techniques can inform broader analytical planning.
For laboratories analyzing contaminants with sem-eds, choose an approach by first considering the consequences of a missed particle, then sample variation, expected volume, and reporting needs. A small, unusual population may demand close manual attention; a stable, repeated screening task may suit standardized automation. In either case, document the method and its boundaries, then review whether results remain fit for the decisions they will inform.
Build a repeatable SEM-EDS workflow around your laboratory’s investigation needs with SEM and EDS equipment and operator training.
Turn SEM-EDS Contaminant Findings into a Defensible Investigation
SEM-EDS results become operationally valuable when they guide a traceable investigation rather than stand alone as a diagnosis. Use the evidence to rank possible sources, then compare those hypotheses with process steps, materials, equipment, and relevant reference samples. Similarity can justify further investigation, but it is not proof of a root cause. State what the findings support, what remains uncertain, and what evidence would change the assessment.
Build a traceable report and prioritize follow-up
A useful report links the original question to sample history, images, spectra, analytical conditions, and interpretation. Keep confirmed observations separate from assumptions and unresolved questions. For each ranked source hypothesis, record the supporting evidence and the next check needed, such as examining a reference material or collecting a sample from a relevant process location.
Translate the investigation into a controlled follow-up plan. Record the corrective action, the responsible team, the expected evidence of effectiveness, and when or under what conditions that evidence will be reviewed. Depending on the finding, verification might involve repeat sampling, comparison with a reference sample, or analysis of material collected after a process change. If attribution remains uncertain, document the gap and identify further sampling or complementary methods that could resolve it. This makes the decision trail reviewable and helps prevent an untested hypothesis from becoming accepted as fact.
- Finding: What was observed, and in which sample or location?
- Assessment: Which source hypotheses are supported, and what evidence is still missing?
- Action: What will change, who owns the action, and what follow-up evidence will assess its effect?
Support consistent analysis with equipment and training
A repeatable laboratory workflow also depends on suitable SEM and EDS equipment and consistent operating practices. Operator training can support SEM and tabletop SEM operation, basic maintenance, and cleaning procedures, helping laboratories apply their methods consistently. Electron Optics Instruments, LLC provides EDS systems and on-site operation training. SEM service is required to keep equipment operating at optimal specifications. EOI’s engineers perform service and training on site, and its service team is available 24/7/365. The factory-trained service engineers have an average of over two decades of experience.
Equipment selection should reflect the investigation’s analytical objectives and the laboratory’s workflow, while training and routine practices help operators collect comparable records over time. EOI offers the Cube II SEM, Genesis SEM, and Veritas SEM families, along with EDS systems. The Cube II SEM has a resolution of 5 nm and magnification up to 300,000×. Together, suitable equipment and consistent operating practices support a reliable path from particle observation to documented follow-up, without implying that an instrument or spectrum alone can establish a source.
To develop your laboratory’s SEM-EDS capability, explore EOI’s SEM and EDS solutions.
Build a Stronger Contamination Control Loop
Use each investigation to strengthen the next one. A particle finding can become a useful baseline for future comparisons when teams preserve relevant records, retain reference samples where practical, and revisit source hypotheses as process or material conditions change. Over time, this feedback loop can help laboratories recognize recurring patterns and focus follow-up on the most relevant process questions.
The value of analyzing contaminants with sem-eds lies not only in characterizing a particle, but also in connecting measured evidence to decisions that can be evaluated. Define what evidence would indicate that a corrective action is working, then make that check part of the investigation plan. If results remain ambiguous, treat the uncertainty as a prompt to refine sampling or seek additional evidence rather than force a definitive explanation.
Equip your laboratory to develop a consistent analytical workflow with support from a company with more than 30 years of electron microscopy industry experience. EOI provides high-quality sales, on-site training, and service for the lifetime of your electron microscope equipment. Its service team is available 24/7/365, with factory-trained engineers who have an average of over two decades of experience. Explore EOI’s SEM and EDS solutions to take a practical next step toward more reliable contamination investigations.
Frequently Asked Questions
Can SEM-EDS identify the exact source of a contaminant?
No. SEM-EDS findings can help rank possible sources, but a particle’s elemental profile rarely identifies a unique origin by itself. For example, similar metal signals may match several components in a production line. Compare candidate materials with reference samples and process records, then look for corroborating evidence, such as where and when particles appear. Treat source attribution as a hypothesis until independent evidence supports it.
Does SEM-EDS identify chemical compounds or only elements?
EDS primarily provides evidence about elements, not definitive identification of a chemical compound or crystal phase. A spectrum containing oxygen and a metal, for instance, does not establish which oxide is present. If the distinction between compounds matters to a decision, use a complementary method suited to chemical or structural identification. Interpret elemental results alongside the particle’s appearance, location, and sample context.
Can SEM-EDS analyze contaminants on a substrate?
Yes. A particle can be examined while it remains on a component, filter, or other material, preserving its location as useful context. The substrate may also contribute to the signal, particularly if the particle is small, thin, or uneven. For a practical comparison, analyze the particle and nearby unoccupied substrate, and document both locations so reviewers can assess possible substrate contribution.
Is automated SEM-EDS always better than manual analysis?
No. Automation can apply defined screening rules consistently across recurring particle populations, while manual review offers flexibility for unusual features or exploratory questions. Automated classification still depends on appropriate setup, and its output needs review, particularly for borderline or atypical particles. A laboratory might use automation for routine screening and direct expert attention to findings that could affect a quality decision.
Can SEM-EDS detect organic contamination?
SEM-EDS can image residues and detect some elements associated with them, but it generally cannot identify organic molecules or determine a residue’s specific chemical identity. Hydrogen is not detected by EDS, and carbon signals may also come from the substrate, mounting materials, or other background sources. If identifying an oil, polymer, or other organic substance is central to the investigation, consider complementary molecular analysis.
Which standards are relevant to SEM-EDS particle contamination analysis?
Relevance depends on the industry and purpose. ISO 16232 and VDA 19.1 address technical cleanliness of components in the automotive context. ISO 15632 concerns EDS spectrometer performance, while ASTM E1508 guides quantitative EDS analysis; ASTM E2809 relates to forensic polymer examinations. These documents have different scopes, so identify the applicable standard and edition for the investigation rather than treating them as interchangeable.
What information should an SEM-EDS contaminant report include?
A report for analyzing contaminants with sem-eds should make each result traceable to its sample and analysis location. Include a unique sample identifier, collection and preparation history, the investigation question, relevant instrument conditions, and linked images and spectra. State detected elements and limitations, then distinguish observations from interpretations and source hypotheses. For follow-up, record proposed actions, the responsible team, and what evidence will be used to assess effectiveness.